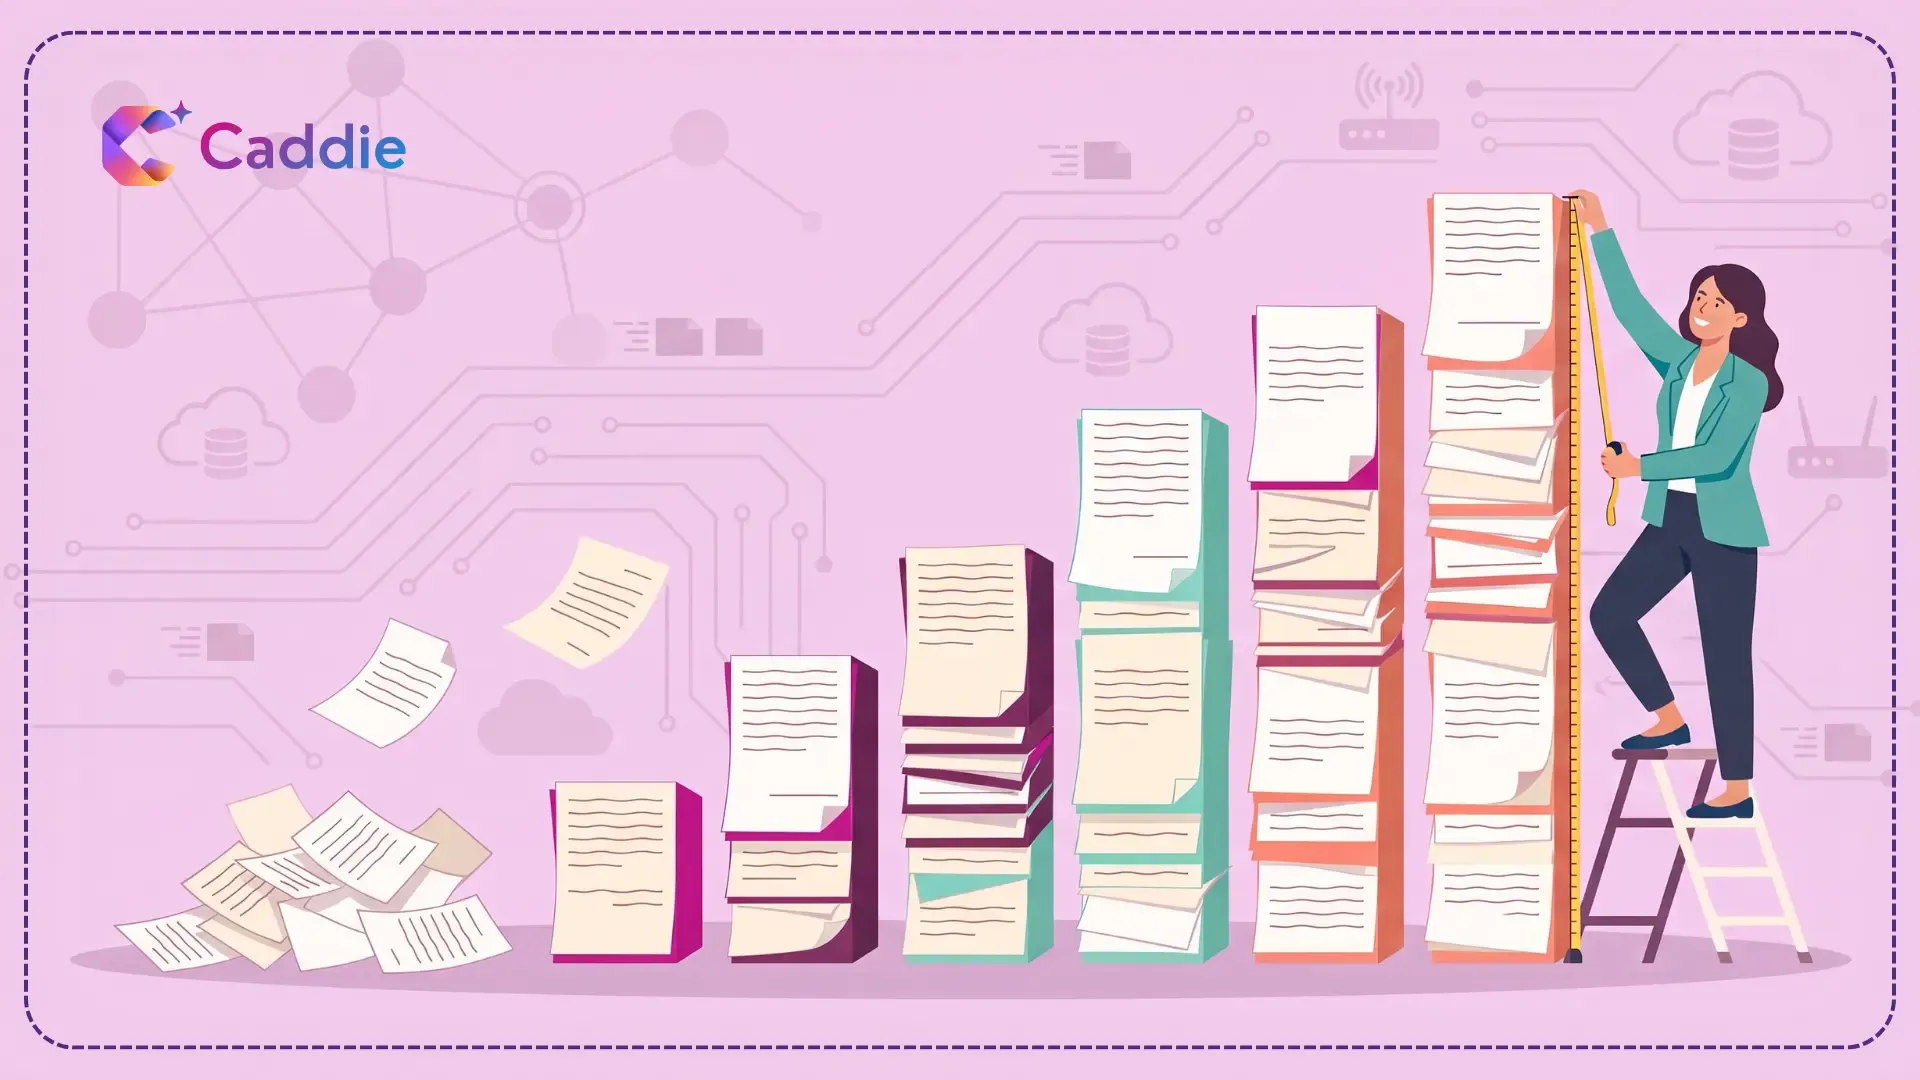
Ask any analytics leader in your mid-to-large enterprise how much of their team's time goes into producing reports, and the answer is almost always uncomfortable. Studies consistently show that your data professionals spend the majority of their working hours not on analysis, interpretation, modeling, and insight generation, but on the mechanics of reporting. This includes pulling data, cleaning it, formatting outputs, reconciling numbers across sources, and responding to ad-hoc requests from stakeholders who needed the answer yesterday.
The reporting workflow, as you probably experience it in your enterprise today, is an expensive, slow, and largely manual process. A request arrives. Your analytics team triages it against competing priorities. A query is written or an extract is pulled. The data is cleaned and validated. A visualization is built. The output is reviewed, revised, and finally delivered, often days after the question was first asked and sometimes longer.
By the time the report lands in a decision-maker's inbox, the business context that generated the question may have already shifted. The answer is technically correct but strategically stale.
AI-powered analytics changes this workflow fundamentally. It does not just make your analysts work faster. Instead, it automates or eliminates the manual steps that consume most of their time. This blog examines where the bottlenecks actually live in your reporting process, what AI does to each stage of the reporting chain, and what faster enterprise reporting looks like when the AI layer is working properly.
The True Cost of the Traditional Reporting Workflow
Before diving into what AI changes, let's talk about what your traditional enterprise reporting workflow actually involves. The problem is not simply that your reports take too long. It's that the effort required to produce them is systematically misallocated, consuming your highest-skill resources on the lowest-value tasks.
Step 1: Request Interpretation
A business stakeholder submits a reporting request. In many organizations, this request is imprecise because the stakeholder knows what business question they need answered but lacks the technical vocabulary to specify the data requirements precisely. Your analyst spends time clarifying scope, confirming the right metrics, agreeing on date ranges and filters, and translating business language into data language.
This translation step alone can take hours. Furthermore, it is repeated for every request, even for reports that are structurally identical to ones your team has built before.
Step 2: Data Extraction and Preparation
Once the request is defined, your analyst identifies the relevant data sources, which may span multiple systems, databases, or platforms, and writes the queries or extraction scripts required to pull the data. In enterprises with fragmented data infrastructure, this step may involve joining data across systems that were never designed to talk to each other.
The extracted data almost always requires cleaning, such as removing duplicates, handling null values, standardizing formats, and resolving naming inconsistencies across sources. According to research, data professionals typically spend 50 to 80 percent of their project time on data preparation rather than analysis. This figure has remained stubbornly high for over a decade despite improvements in tooling because the underlying data quality and fragmentation problems have not been solved.
Step 3: Analysis and Visualization
With clean data in hand, your analyst performs the actual analysis and builds the visualization. This is the step that creates genuine value by interpreting what the data means, identifying patterns, and selecting the right chart type to communicate a finding clearly. It is also, typically, the smallest proportion of total time spent on your reporting workflow.
Step 4: Review, Revision, and Delivery
The output goes through review cycles. Your stakeholders ask follow-up questions, request different cuts of the data, or identify discrepancies with other reports they have seen. Each revision loops back through extraction and formatting. The report may go through three or four versions before it is accepted. Then it is manually formatted for the delivery channel, like an email, presentation deck, or dashboard update, and sent.
The total elapsed time from request to delivery in this model is commonly measured in days. For ad-hoc requests in fast-moving environments, that is often too slow to be useful.
Where AI-Powered Analytics Intervenes in the Reporting Chain
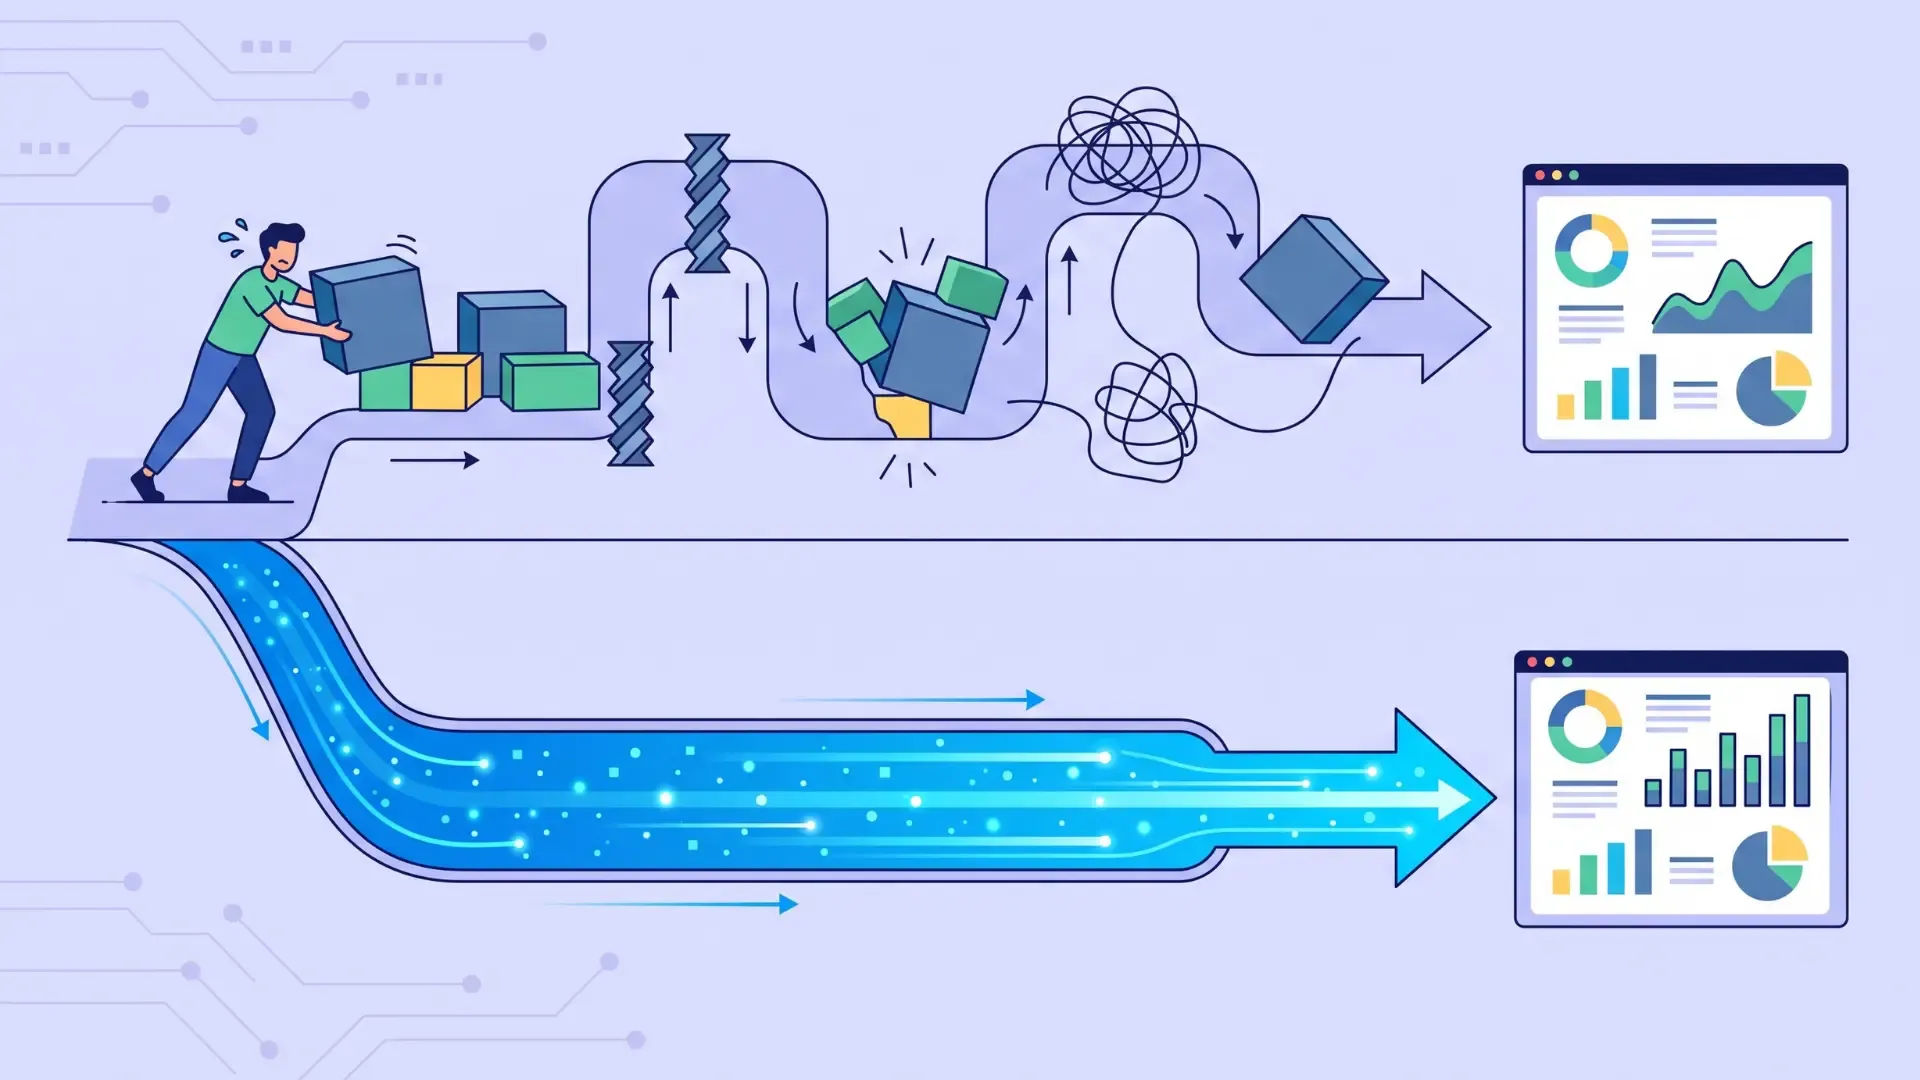
AI does not replace your reporting workflow, it automates the steps that consume the most time and require the least judgment. This concentrates your human effort on the steps where interpretation and strategic thinking genuinely matter.
Automating Request Interpretation via Natural Language
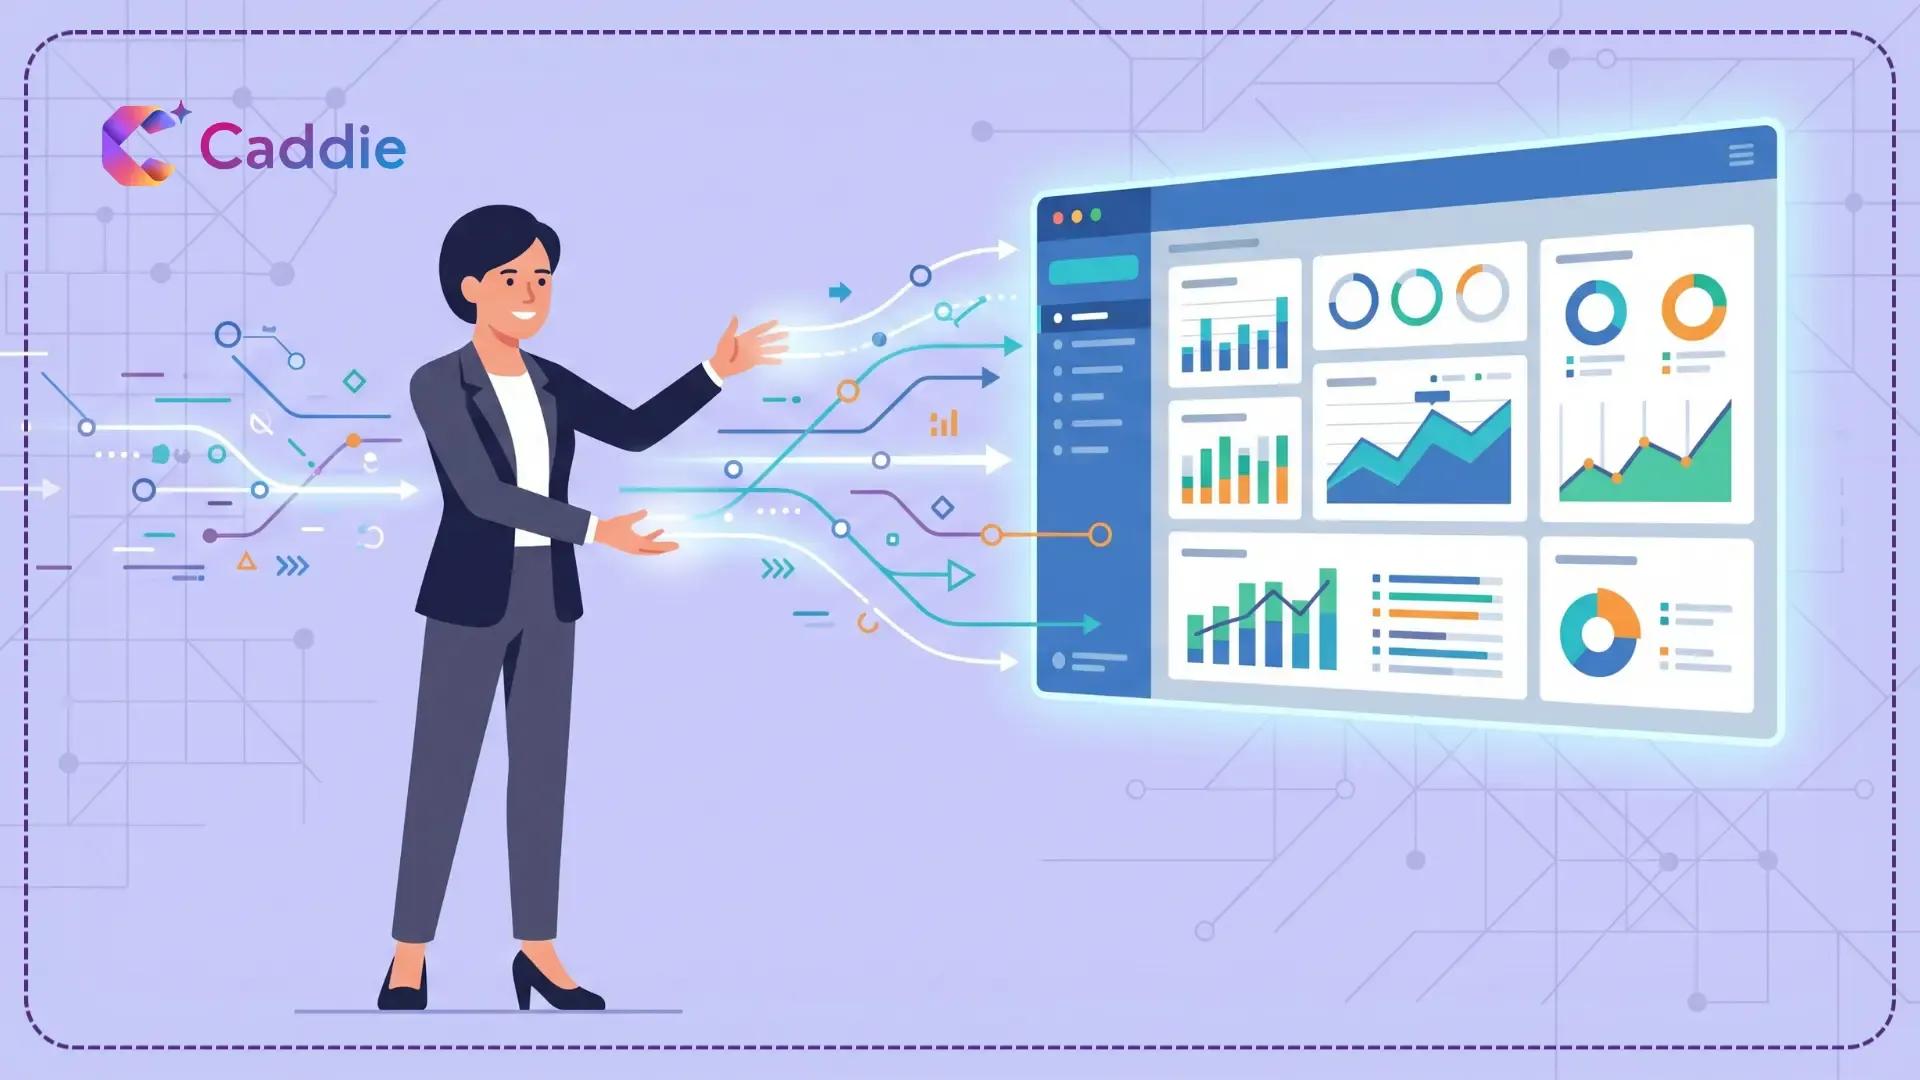
The first and most transformative intervention happens at the request layer. AI-powered analytics platforms built on natural language query (NLQ) technology allow your business users to ask questions directly in plain English and receive an answer without the request ever reaching an analyst.
When your finance manager types "Show me operating expenses by department for Q2 compared to Q1" into an AI analytics platform, the system interprets the intent, maps it to the correct data sources, constructs the appropriate query, and returns a visualization in seconds. The translation step that used to consume your analyst's time simply does not happen.
This is not just a marginal efficiency gain. In environments where a significant proportion of reporting requests are straightforward standard metrics, familiar dimensions, or recurring business questions, automating request interpretation can completely eliminate the majority of inbound reporting volume from your analytics team's queue.
Accelerating Data Preparation Through AI-Assisted Quality Layers
AI cannot fully solve your underlying data quality problems, but it can dramatically accelerate the identification and handling of common data issues. Modern AI reporting tools incorporate automated data profiling. They scan incoming data for anomalies, flag null values, detect schema mismatches, and surface data quality exceptions before they propagate into your reports.
Some platforms go further by applying machine learning models to impute missing values, detect and deduplicate records, and standardize entity names across sources. Tasks that previously required manual inspection and scripted transformation logic can be partially or fully automated. This substantially reduces your time from raw data to analysis-ready data.
This is closely related to your data governance layer. AI-assisted quality checks are most effective when they operate within a defined governance framework that establishes what clean, consistent data looks like for each domain.
Generating Narrative Insights Automatically
One of the most underappreciated capabilities of modern AI-powered analytics is automated narrative generation. This is the ability to produce written commentary explaining what a dataset shows instead of just displaying the numbers visually.
Rather than a chart that shows revenue declining 8% month-over-month and leaving the interpretation to the reader, an AI analytics platform can generate a sentence like: "Revenue declined 8% in June, driven primarily by a 23% drop in the enterprise segment, which offset a 12% gain in SMB. The enterprise decline correlates with three large renewals that shifted to Q3." This is the analytical commentary that your skilled analyst would produce, but it is being generated automatically in seconds from the underlying data.
For your routine reporting, such as weekly performance summaries, monthly business reviews, or recurring board-level dashboards, this capability eliminates the manual narrative-writing step almost entirely. It produces commentary grounded in actual data rather than edited from a prior period's template.
Eliminating Revision Cycles Through Conversational Follow-Up
A significant proportion of your total reporting effort is not in the initial production of a report but in the revision cycles that follow. A stakeholder sees a result, wants a different cut, asks a follow-up question, or requests a new dimension added. Each of these requests triggers another round of analyst work.
AI-powered conversational analytics platforms eliminate this loop by making follow-up questions self-service. When your stakeholder can ask "Now break that down by region" or "How does this compare to the same period last year?" and receive an immediate answer, the revision cycle moves at the speed of conversation rather than the speed of analyst queue management.
Your report is no longer a fixed artifact that gets revised. It becomes a dynamic conversation with the data that the stakeholder can conduct independently, without your analytics team re-entering the loop for every iteration.
What Enterprise Reporting Automation Actually Looks Like in Practice
The abstract description of AI-powered analytics is compelling. However, the practical manifestation varies significantly depending on how mature your implementation is. It is worth distinguishing between what genuine business analytics automation delivers versus what is often marketed as automation but falls short.
Genuine Automation: Outputs Produced Without Human Intervention
A mature enterprise reporting automation layer can produce scheduled report outputs, like weekly performance summaries, daily operational briefings, and monthly financial overviews, without any analyst involvement in any individual cycle. The system pulls live data, runs your pre-defined analysis, generates the narrative, and distributes the output to defined recipients on schedule.
When an anomaly falls outside expected ranges, the system flags it automatically and includes it in the narrative commentary rather than waiting for a human reviewer to notice it. When a metric crosses a defined threshold, an alert is triggered proactively. Your analyst's involvement shifts from producing every output to defining and maintaining the automation rules. This is a fundamentally different and higher-value use of their time.
Assisted Analysis: AI Accelerating Human Judgment
Not every reporting task can or should be fully automated. Strategic analysis for interpreting competitive dynamics, evaluating investment decisions, or diagnosing complex operational problems requires human judgment that AI cannot replace. What AI can do is dramatically accelerate the preparation work that precedes that judgment.
An analyst who previously spent four hours pulling and cleaning data before spending two hours on the actual analysis can, with AI-assisted preparation, spend thirty minutes on the data work and five hours on the analysis. The analytical output improves in quality and depth, not just in speed, because your human talent is spending more time where their skill actually matters.
Proactive Insight Surfacing: The Report No One Knew to Request
The most sophisticated form of enterprise reporting automation is not just faster enterprise reporting for requests that were already made. It is the surfacing of AI business insights that no one thought to ask for.
AI systems that continuously monitor your enterprise data can identify patterns, correlations, and anomalies that would never appear in a scheduled report because no one knew to look for them. This might be a sudden change in the ratio of support tickets to active users in a specific product cohort. Or an unusual spike in payment processing times correlating with a regional banking holiday. Or a new sales rep whose conversion rate is 40% above the team average on a specific product line.
These are the insights that could change decisions. These are the insights that the traditional reporting model, built around answering questions that were already formulated, is structurally incapable of delivering.
The Impact on Analytics Teams: From Report Factory to Strategic Function
The organizational consequence of enterprise reporting automation deserves its own discussion because it changes what your analytics teams are actually for, not just how fast they work.
In the traditional model, a significant portion of your analytics team's capacity is consumed by report production: maintaining existing reports, responding to ad-hoc requests, managing data extracts, and troubleshooting output discrepancies. These are necessary tasks, but they are not the reason you built the team. They are the overhead that accumulated as business users discovered that the analytics team could answer their questions and began routing all data questions through that single point.
When AI-powered analytics handles the bulk of routine reporting and ad-hoc question-answering, your analytics teams are freed to do the work that creates strategic value. They can build predictive models, design data products, improve data infrastructure quality, develop self-service analytics capabilities that scale data access across the organization, and partner with business functions on complex analytical problems that require deep domain context.
This reallocation is not automatic, as it requires your deliberate organizational change alongside the technology investment. But the technology creates the headroom for it in a way that simply hiring more analysts never could.
Evaluating AI Reporting Tools: What to Look For
Not every tool that claims to offer AI-powered analytics delivers the same capabilities. When evaluating platforms for enterprise reporting automation, the following criteria separate genuine capability from marketing language:
Natural Language Interface Quality
The quality of the NLQ layer determines how broadly usable the platform is. A strong NLQ implementation handles ambiguous phrasing, domain-specific terminology, multi-step questions, and follow-up queries that reference prior context. A weak one requires precise, structured inputs that your non-technical users will not consistently provide.
Data Source Coverage and Connectivity
AI analytics is only as useful as the data it can reach. Your chosen platforms should connect natively to the data sources that matter most for your enterprise, such as cloud data warehouses, CRM systems, ERP platforms, and operational databases, without requiring extensive custom integration work for each connection.
Governance and Access Control
Automation at scale creates governance risk if access controls are not built into the platform's core. The right platform enforces row-level and column-level security, applies consistent metric definitions across users and functions, and logs every query for audit purposes. This ensures that faster enterprise reporting does not come at the cost of your data integrity or compliance.
Narrative and Explanation Quality
The usefulness of automated narrative generation depends entirely on whether the generated text is accurate, contextually appropriate, and genuinely interpretive, rather than just a mechanical recitation of the numbers the chart already shows. Evaluating this requires testing the platform against real data from real business scenarios, not controlled demos.
Integration with Existing Workflows
AI reporting tools that live in isolation and require users to switch to a separate interface, re-enter context, or duplicate work from other systems will see lower adoption than those that integrate with the tools your business users already use. Distribution of reports and alerts through Slack, Teams, email, or embedded in existing operational platforms significantly increases the likelihood that insights reach your decision-makers when they are relevant.
How Caddie Accelerates Enterprise Reporting
Caddie is a powerful AI layer that seamlessly connects to your existing enterprise data infrastructure, making it more productive. Your business users can easily ask questions in plain English through a natural language interface, receiving immediate, visually supported answers backed by live data. The platform automatically generates analytical commentary to clearly explain what your numbers mean, eliminating the need for manual reports. By handling routine requests, Caddie frees your analytics team to focus entirely on complex, strategic work. Get reliable answers instantly without rebuilding your systems.
Want to see how Caddie handles your live data? Request a personalized demo today and experience faster answers firsthand.
Frequently Asked Questions
What is AI-powered analytics?
AI-powered analytics uses artificial intelligence, NLP, and machine learning to automate analytics processes. It helps you interpret questions, query data, and proactively surface insights without manual effort.
How does AI speed up enterprise reporting?
AI automates time-consuming tasks like data extraction, visualization generation, and narrative writing. This delivers faster enterprise reporting by completing in seconds what used to take your analysts days.
What is enterprise reporting automation?
Enterprise reporting automation uses software to produce business reports without manual effort. It automatically schedules reports, distributes them, flags anomalies, and handles your team's follow-up questions via self-service interfaces.
What are the best AI reporting tools for enterprises?
The best AI reporting tools combine high-quality natural language interfaces, broad data connectivity, and robust governance. The ideal tool seamlessly integrates directly into your existing business workflows.
How does AI improve business analytics for non-technical users?
AI lets you ask questions in plain English. Automated narrative generation and proactive alerting provide clear explanations of your data, making business analytics automation highly accessible and actionable.
What is the difference between AI analytics and traditional BI?
Traditional BI relies on static visualization tools. AI analytics adds an intelligence layer, offering natural language querying and automated commentary to actively help you understand your business insights.