There is a particular kind of frustration that you probably know well as an enterprise leader. You open a dashboard to understand what is happening right now, and what you are actually looking at is what happened last Tuesday.
Static dashboards were built for a different era of business. They assumed that weekly or daily snapshots were sufficient for decision-making and that the pace of operations was slow enough that a 24-hour data lag would not materially affect your outcomes. That assumption no longer holds in most industries. Customer behavior shifts in hours. Inventory positions change with every shipment. Campaign performance rises and falls within a single news cycle. Pricing signals from competitors appear and disappear in real time.
The gap between when something happens in your business and when you see it reflected in your analytics is not a minor inconvenience. It is a strategic liability. For a growing number of enterprises, closing that gap has become one of the highest-priority investments in their analytics stack.
This blog explores what static dashboards were designed to do, where they fall short in the modern enterprise environment, what real-time business insights actually require at a technical and organizational level, and what separates analytics platforms that deliver genuine live intelligence from those that merely claim to.
What Static Dashboards Were Built to Do (and Why That Is No Longer Enough)
Static dashboards emerged from a legitimate need to surface summarized, visual representations of business performance on a recurring basis. In the early days of business intelligence, your alternative was waiting for a scheduled report to arrive by email, a process that could take hours or days. A dashboard that refreshed nightly felt like a significant leap forward.
The core model of a static dashboard is snapshot-based. Data is extracted from your source systems on a schedule (hourly, daily, weekly), transformed and loaded into a reporting layer, and then visualized in a fixed format. The dashboard reflects the state of your business at the last extraction point. It is accurate as of that moment and increasingly inaccurate from that moment forward.
This worked reasonably well when:
- Business cycles were measured in weeks or months, not hours or days.
- Data volumes were small enough to process in overnight batch jobs.
- Decision-makers needed to review performance, not respond to it in real time.
- The competitive environment was stable enough that a one-day lag in information carried no meaningful cost.
- None of these conditions reliably describe the modern enterprise. What was once a workable compromise has become a structural constraint. It is a reporting model designed for a pace of business that no longer exists.
The Hidden Cost of Stale Data
The cost of operating on delayed data is rarely visible in a single decision. It accumulates across hundreds of smaller decisions made daily by your managers, directors, and frontline operators who are working from information that does not reflect current conditions. This perfectly highlights the most severe static dashboards limitations.
Missed Revenue Opportunities
In retail and e-commerce, inventory positions and demand signals change continuously. A static dashboard that shows strong stock levels as of yesterday's batch run may not reflect the surge in orders that arrived overnight. By the time your operations team sees the stockout risk the next morning, the opportunity to reorder or reallocate has already passed.
A dashboard that refreshes weekly cannot surface the early engagement signals, like email opens, product page visits, or feature usage spikes, that indicate when an account is ready for an expansion conversation. When your sales teams act on last week's data, they are consistently a step behind.
Slow Response to Operational Issues
Manufacturing, logistics, and service operations generate continuous performance signals like machine output rates, delivery exception rates, service queue lengths, and quality control flags. Static reporting that aggregates these into daily summaries transforms urgent issues into historical footnotes.
A production line running 12% below target for six hours before anyone sees it in a dashboard is a very different problem from one that is flagged within minutes. The difference is not the fault of your operations team. It is a failure of your information infrastructure to surface the signal when it can still be acted on.
Reactive Rather Than Proactive Decision-Making
Perhaps the most significant cost of static dashboards is not any single missed decision, but the organizational posture they create. When analytics shows what happened, your decisions are necessarily retrospective. You end up diagnosing the past rather than shaping the present. Leaders become comfortable explaining outcomes rather than influencing them.
Real-time business insights shift this dynamic. When the data reflects current conditions, you can make decisions before issues escalate, before opportunities close, and before competitors act. Your analytical posture shifts from reactive to proactive.
What Real-Time Business Insights Actually Require
"Real-time analytics" is a phrase that vendors apply liberally, sometimes to describe systems that refresh every 15 minutes. It is worth being precise about what genuine real-time business insights require, both technically and organizationally.
Live Data Connectivity
The foundation of real-time insights is a direct connection to live data sources, such as operational databases, CRM systems, ERP platforms, event streams, and external feeds, rather than a periodic extract-transform-load pipeline. This does not necessarily mean sub-second latency for every use case. It means that the data available to your analytics layer reflects the current state of the source systems within a timeframe that is meaningful for the decision being made.
For an executive reviewing quarterly trends, a daily refresh may be real-time enough. For a customer success manager monitoring product usage during an upsell call, anything longer than a few minutes is stale. The definition of real-time is always relative to the decision it is meant to support.
Streaming Architecture vs. Batch Processing
Traditional BI infrastructure is built on batch processing. Data is collected in bulk, processed in scheduled jobs, and loaded into a warehouse at fixed intervals. This architecture is efficient at scale but fundamentally incompatible with real-time requirements.
A modern real-time analytics platform is increasingly built on streaming architectures. Modern systems process data as individual events the moment they occur, rather than waiting to collect them into a batch. This allows your analytics layer to reflect what is happening now, not what had happened by the time the last batch ran.
AI-Powered Interpretation, Not Just Faster Delivery
Delivering data faster is necessary but not sufficient. Real-time data without interpretation is just noise. What your enterprise actually needs is not just live data on a screen. You need live data with the context to understand what it means and what to do about it.
This is where AI-powered analytics becomes essential to modern real-time analytics. Conversational analytics platforms apply AI layers on top of live data connections to do what a static dashboard cannot. They identify anomalies automatically, generate narrative explanations of what is changing and why, and surface recommendations without requiring you to know what questions to ask.
The combination of natural language querying and real-time data means your business users can ask, "Why did our conversion rate drop in the last two hours?" and receive an immediate, data-backed answer, rather than filing a request with the analytics team and waiting until the next day's dashboard refresh.
Governed Access at Speed
One of the legitimate concerns about real-time analytics is data governance. When data moves faster, so do the risks associated with unauthorized access, data quality errors, and inconsistent definitions across departments.
Enterprise-grade real-time analytics requires data governance controls that operate at the same speed as the data itself. You cannot rely on governance frameworks that were designed for overnight batch processing and retrofitted onto streaming pipelines. This means you need role-based access controls applied at the query level, automated data quality checks on incoming streams, and consistent metric definitions enforced across every user and every function.
Where Modern BI Dashboards Fall Short (and What Replaces Them)
Modern BI tools, including the most widely adopted enterprise analytics tools, have improved substantially over the previous generation. Many now offer shorter refresh cycles, cloud-native architectures, and more flexible visualization options. But the fundamental model of the dashboard has not changed. It is still a predefined set of charts, filtered and configured in advance, waiting to be looked at.
The core limitations of this model persist regardless of how modern the underlying platform is:
Fixed Questions, Fixed Answers
A dashboard is an answer to a question that someone decided to ask when they built it. If the question changes, if a new variable becomes relevant, if the business context shifts, or if an anomaly requires a different angle of analysis, the dashboard cannot follow. Someone has to rebuild it, or create a new one, which brings your analytics team back into the loop.
The modern enterprise is too dynamic for a fixed-question analytics model. Your business users need the ability to follow their curiosity. They need to drill into an unexpected pattern, add a new dimension to an existing view, or ask a follow-up question the moment a metric raises one. Static dashboards cannot do this. Live, AI-powered analytics can.
Passive Display vs. Active Intelligence
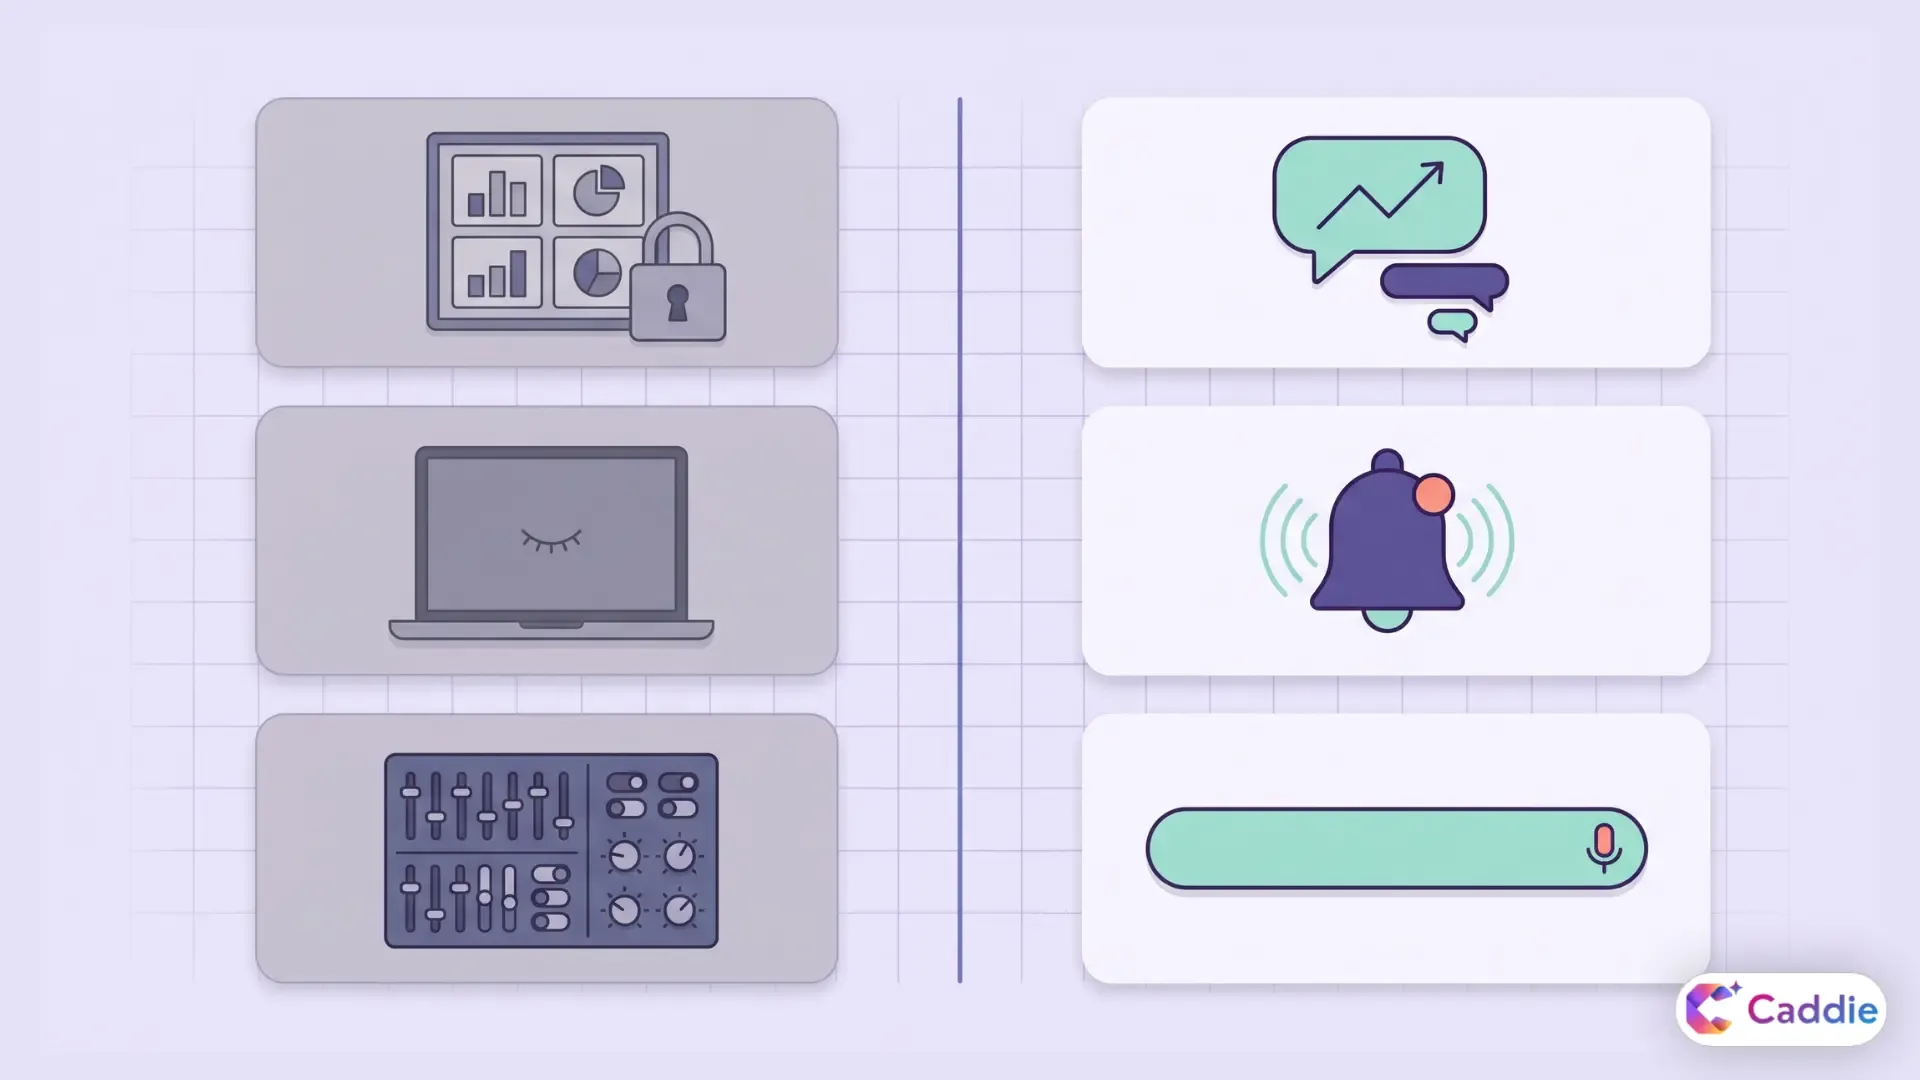
A dashboard just sits there. It displays what it was configured to display. It does not tell you when something important has changed, it does not alert you to an emerging issue, and it does not proactively surface the insight you did not know to look for.
Even modern BI dashboards are falling behind as enterprise tools move toward active intelligence. These are systems that monitor data continuously and surface anomalies, threshold breaches, and significant trends without waiting for you to open a screen. This is the difference between a report and an intelligence layer. One shows you the world when you choose to look; the other tells you when you need to look.
User Experience Designed for Analysts, Not Decision-Makers
Most BI dashboard interfaces were designed with analysts in mind. Configuration options, filter hierarchies, chart type selectors, date range pickers, the interaction model assumes a user who is comfortable navigating analytical software.
The executives, managers, and operational leads who most need real-time business insights are typically not this user. They need an interface that meets them where they are: asking a plain-language question and receiving a clear, immediate answer. This is the design principle that self-service analytics platforms built on natural language interfaces are designed around.
Real-Time Insights Across Enterprise Functions
The case for real-time analytics is not abstract. It is most clearly visible in the specific workflows of each enterprise function where delayed data creates measurable costs.
Sales and Revenue Operations
Real-time pipeline visibility allows your revenue operations teams to identify stalled deals, monitor quota attainment by rep and territory, and flag accounts showing disengagement signals, all within the current period rather than at month-end review. The difference between catching a deal at risk in week two versus week four of a quarter is often the difference between recovery and a miss.
Marketing and Campaign Performance
Digital campaigns generate performance data by the minute. Real-time analytics allow your marketing teams to redirect spend from underperforming channels in hours. You can test messaging variants and get statistically meaningful results within a single day, tying lead quality back to the campaign source in real time. None of this is possible when performance data arrives in a daily or weekly batch.
Supply Chain and Operations
Inventory levels, supplier lead times, logistics exceptions, and production throughput are all time-sensitive signals. Real-time visibility allows your operations teams to respond to disruptions before they cascade. You can optimize distribution based on current demand rather than forecasted demand, maintaining service levels in the face of volatility that a static report would surface too late to address.
Finance and Risk
Your treasury, accounts receivable, and risk management functions depend on current data to make decisions that have significant financial consequences. Real-time cash position monitoring, live accounts receivable aging, and continuous transaction anomaly detection are all capabilities that batch-based dashboards structurally cannot provide.
How Caddie Delivers Real-Time Business Insights
Caddie makes real-time business insights accessible to all users by connecting directly to live enterprise data through a natural language interface. Users can ask questions in plain English to receive immediate, accurate, and visually supported answers without relying on static dashboards, scheduled refreshes, or analyst intermediaries.
Additionally, Caddie supports active intelligence by continuously monitoring live data and proactively surfacing alerts for threshold breaches and anomalies. This shifts enterprise analytics from periodic scheduled reviews to continuous awareness, making cloud data infrastructure directly actionable for decision-makers in real time.
Want to see how Caddie handles your live data? Get a personalized demo and experience faster answers firsthand.
Frequently Asked Questions
What are real-time business insights?
Real-time business insights are analytical outputs reflecting your organization's current operational state. They empower you to make immediate decisions based on live data, rather than relying on outdated historical snapshots.
What are the main limitations of static dashboards?
Static dashboards suffer from scheduled data delays, fixed question formats, and passive display models. They require technical proficiency, making them entirely unsuited for the speed of modern enterprise decision-making.
What is a real-time analytics platform?
A real-time analytics platform connects directly to live data sources. It surfaces current business performance instantly, combining streaming architecture, AI interpretation, natural language querying, and proactive alerting for rapid action.
How is live business reporting different from traditional reporting?
Traditional reporting looks backward at closed periods. Live business reporting reflects exactly what is happening right now, updating continuously to support proactive, immediate decision-making instead of after-the-fact reviews.
What makes modern BI dashboards different from legacy ones?
Modern BI dashboards offer faster refreshes and cloud architectures. However, the most advanced platforms completely replace dashboards with natural language interfaces and AI alerts for effortless, instant data discovery.
Why do enterprises need real-time analytics tools?
Enterprise operations change constantly. Decisions based on old data create compounding costs across your organization. Real-time analytics tools bridge the gap between business events and your ability to respond.