At its core, Business Intelligence (BI) is a technology-driven process for analyzing data and presenting actionable information to help executives, managers, and other corporate end users make informed business decisions.
In today’s hyper-competitive digital economy, data is often called the new oil. Every click, every swipe, every transaction generates a data point. However, simply having data is not enough. The real challenge and the real opportunity lie in transforming raw information into actionable insights that drive revenue and innovation. This is where Business Intelligence (BI) enters the picture.
If you’ve ever wondered what is business intelligence and how it can revolutionize your organization, you’ve come to the right place. In this detailed guide, we will break down the definition, history, processes, benefits, and future of what is bi, providing you with a clear roadmap to becoming a truly data-driven organization.
BI encompasses a wide variety of tools, applications, and methodologies that enable organizations to collect data from internal systems and external sources, prepare it for analysis, develop and run queries against that data, and create reports, dashboards, and data visualizations. The primary goal is to make all these analytical results available to corporate decision-makers.
What is BI if not the bridge between raw, often chaotic data sets and the crystal-clear strategies that propel a company forward? It is the process of asking questions and using data to find objective, reliable answers.
A Brief History of Business Intelligence (BI)
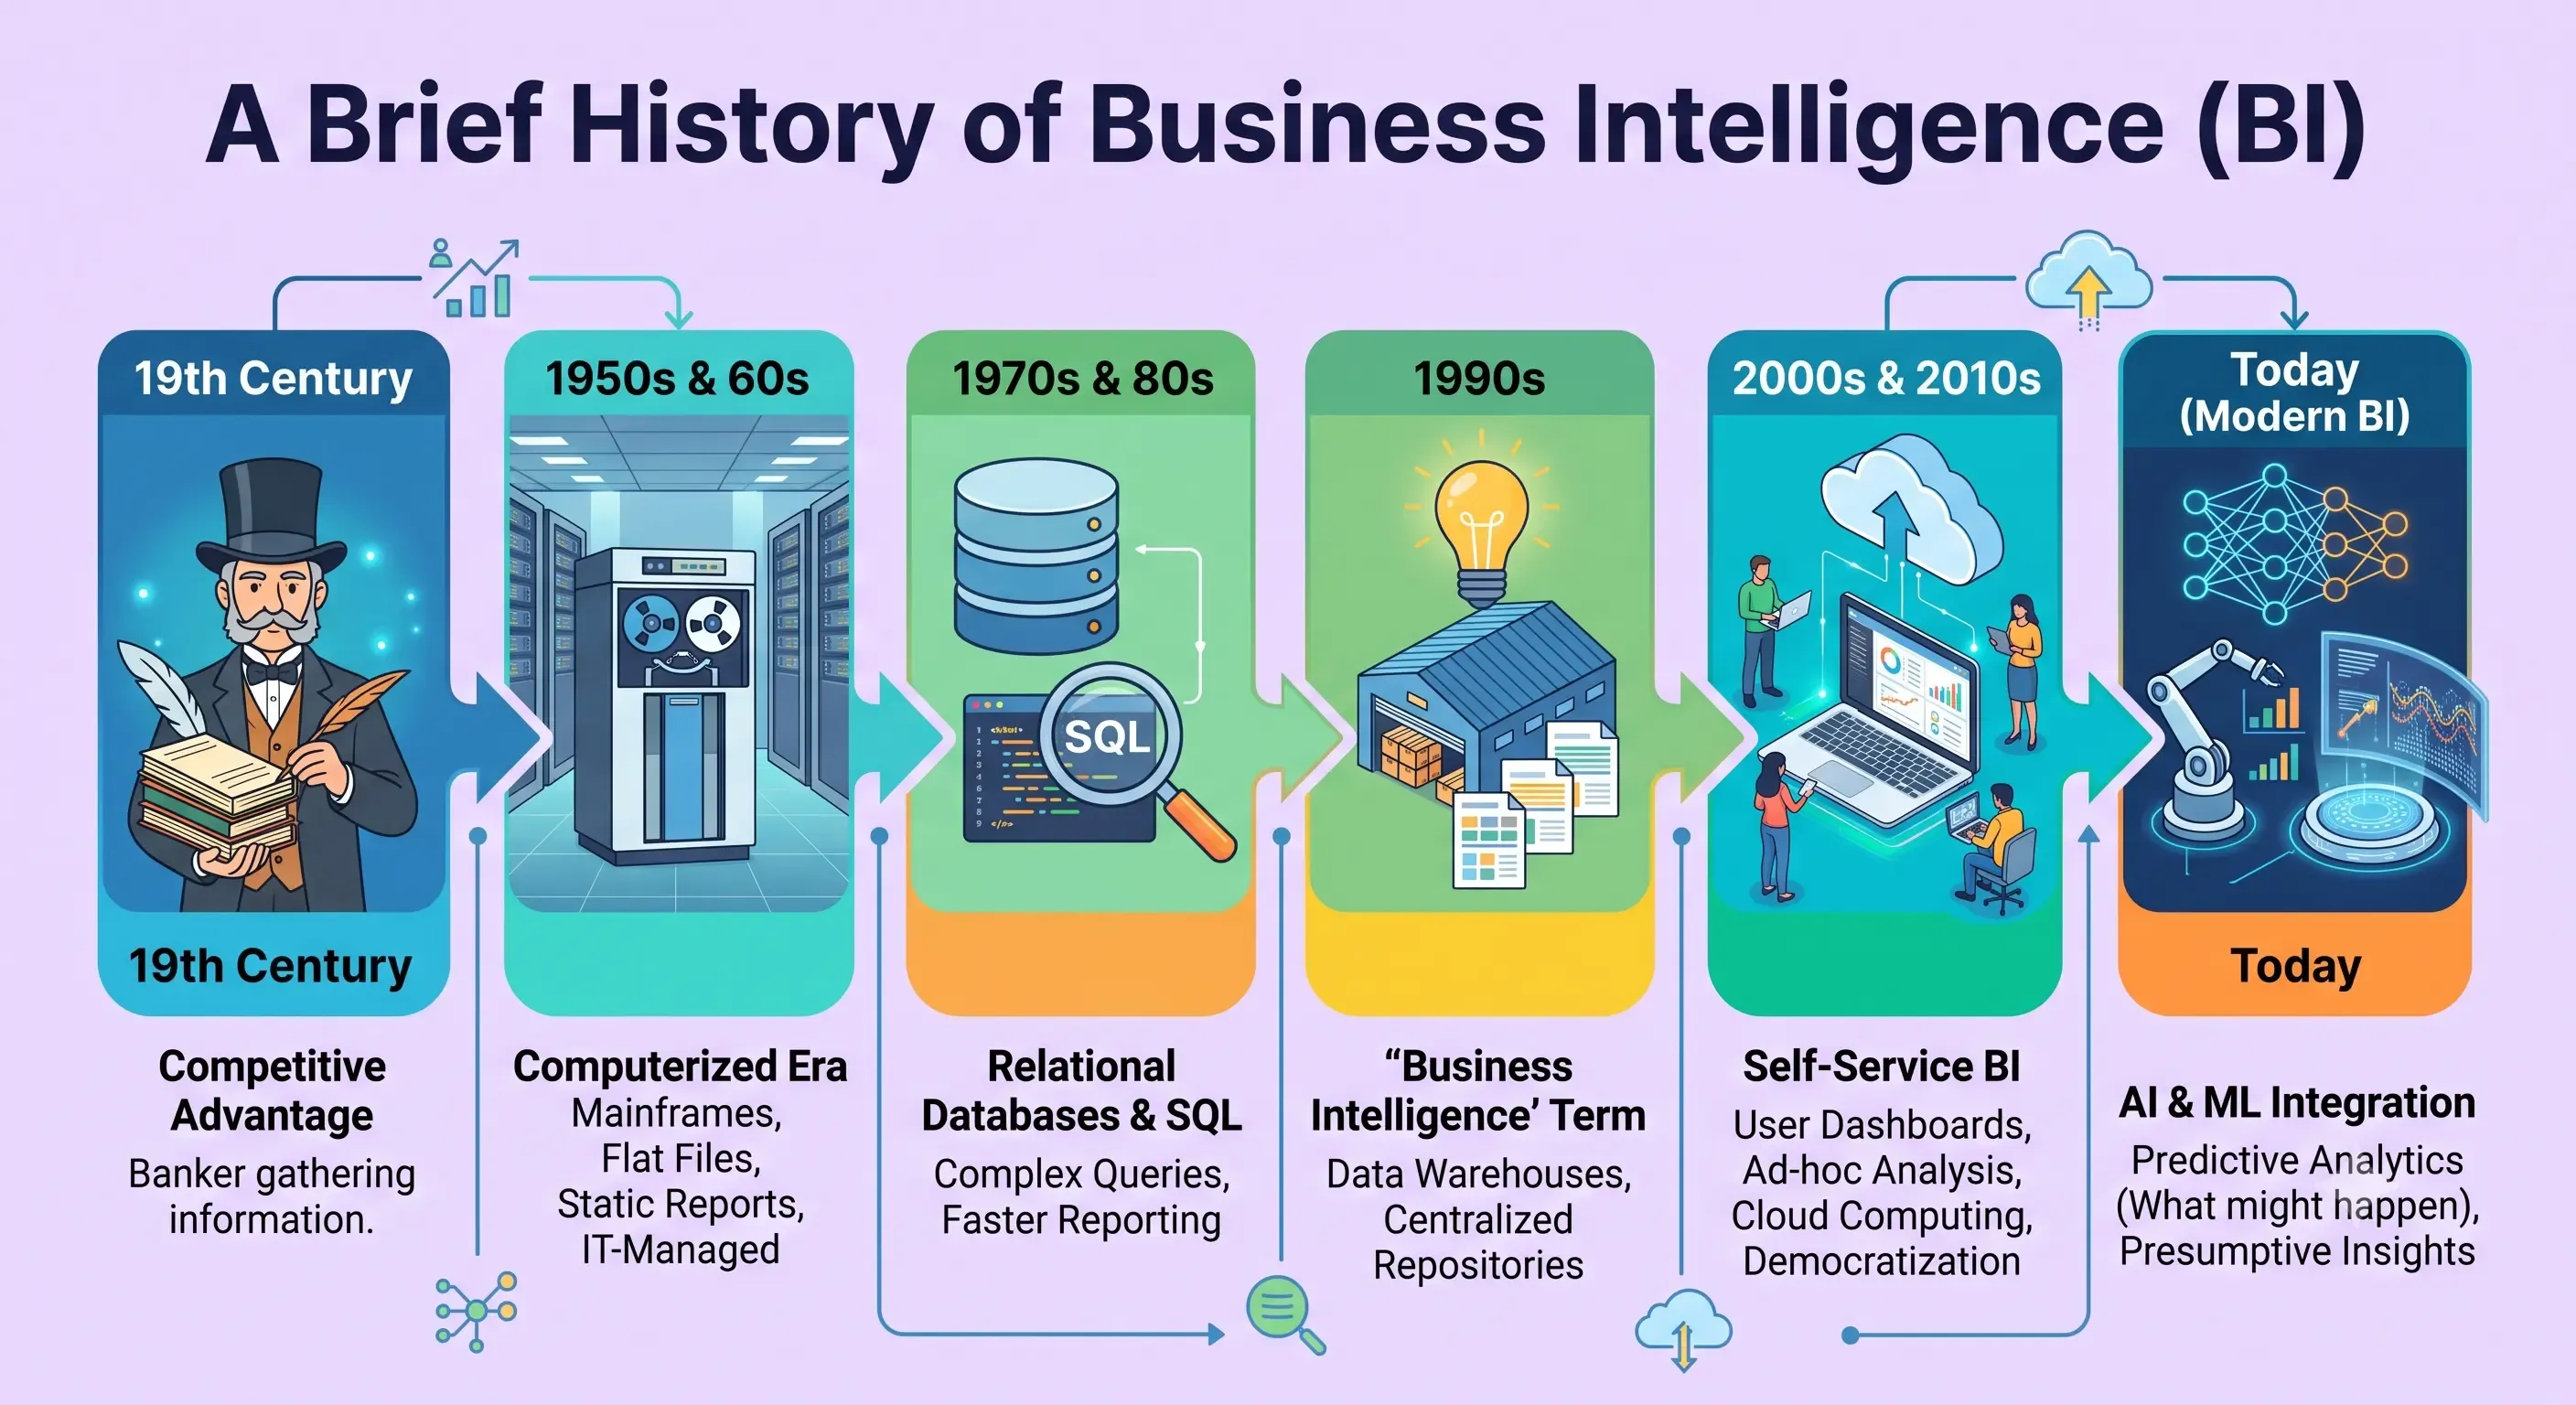
The concept of BI is not new, though its implementation has evolved dramatically. The history of business intelligence can be traced back to the 19th century, where it was first used in a business context by Richard Millar Devens to describe how a banker gained a competitive advantage by gathering information from various sources before competitors.
The computerized era of BI began in the 1950s and 60s with the advent of large mainframe computers. Data was stored in flat files. Reporting was slow, static, and managed entirely by IT departments. A request for a sales report might take weeks to fulfill.
In the 1970s and 80s, the emergence of relational databases and SQL (Structured Query Language) allowed for more complex queries and faster reporting. The 1990s introduced the term "Business Intelligence" as we know it, championed by analysts at companies like Gartner. Data warehouses became the centralized repositories for this analysis.
The 2000s and 2010s saw the rapid development of self-service BI tools. Instead of relying on IT to build every report, business users gained the ability to create their own dashboards and perform ad-hoc analysis. Cloud computing further accelerated this democratization. Today, modern BI tools are increasingly integrating artificial intelligence (AI) and machine learning (ML), moving from descriptive analytics (what happened) toward predictive analytics (what might happen).
How Business Intelligence Works: The Data Journey
To understand how business intelligence works, you need to understand the underlying architecture that facilitates the movement and transformation of your information. The process follows a logical, structured path from raw data inception to finalized insight, functioning as a four-step pipeline:
Data Sources
The journey begins at the origin of the information. These sources can include internal, structured data like Customer Relationship Management (CRM) databases, Enterprise Resource Planning (ERP) systems, and daily transactional databases. They can also include external or unstructured data like social media feeds, market research, or web analytics.
Data Integration (ETL - Extract, Transform, Load)
This is the heavy lifting of BI. This critical phase extracts raw data from those disparate sources mentioned above. It then transforms that data by cleaning, formatting, and harmonizing it into a cohesive, standardized structure. Finally, it loads it into the storage layer.
Data Storage (Data Warehouses)
Once cleaned, the data needs a centralized home. A data warehouse is a large, optimized repository designed specifically for reporting and analysis. (In the era of big data, some architectures also incorporate "Data Lakes" for raw, unstructured data). This optimized storage is essential for ensuring that complex, high-speed queries don't slow down the operational databases that run your day-to-day business.
Analysis and Reporting (BI Visualization)
This final layer completes the journey. This is where users actually interact with the data through BI analytics platforms. Using visualization tools like dashboards, heat maps, and scorecards, this layer renders the warehoused data into interactive charts and intuitive reports, which are then delivered to the final consumers: the business decision-makers.
What are the 5 Stages Of Business Intelligence?
The previous section described the technical architecture. To understand the process flow that turns raw data into value, we must examine the five distinct stages that an organization must traverse. These 5 stages of business intelligence are crucial for ensuring data becomes actionable intelligence:
Stage 1: Data Ingestion (Gathering)
This initial stage focuses on identifying and accessing data sources. Data ingestion is the process of moving data from various sources into the centralized processing environment (often a data lake or staging area). This is a technical step ensuring reliable connectivity and data availability, highlighting the core principles of Data Governance vs Data Management.
Stage 2: Data Refinement (Cleansing & Transformation)
Raw data is almost always "dirty" (containing duplicates, errors, missing fields, or inconsistent formats). In the data refinement stage, the data is cleaned, validated, and transformed. This is a critical business intelligence analysis step, as poor data quality leads to unreliable insights. ETL tools and data preparation platforms are essential here.
To learn how to establish rules for maintaining high-quality data across your organization, read our detailed piece on What is Data Governance?.
Stage 3: Data Analysis (Processing & Modeling)
Once the data is clean and stored in a data warehouse, this stage involves the application of advanced mathematical and logical analysis. BI analytics activities occur here, using statistical methods, data mining, and SQL queries to identify patterns, correlations, and trends within the data. Analysts build data models that structure the information in ways that answer specific business questions (e.g., product performance by region over time).
Stage 4: Data Visualization (Reporting)
Humans are visual learners. The most robust analysis is useless if it cannot be communicated effectively. In this stage, complex results are translated into intuitive, dynamic visualizations. BI tools generate dashboards, heat maps, and scorecards that allow users to see relationships and exceptions at a glance.
Stage 5: Data-Driven Action (Deployment & Iteration)
This is the final and most important stage. Information is deployed to decision-makers. Stakeholders use these dashboards to make strategic choices, identify operational improvements, and gain competitive advantages. Crucially, this stage includes monitoring the results of those actions and iterating back through the stages (often by asking new questions), creating a feedback loop of continuous improvement.
Different Types of Business Intelligence
When organizations implement BI, they are not engaging in a single activity. There are different approaches depending on the scope of the decision-making:
Operational BI
This focus is on current, minute-by-minute or real-time data to manage immediate business operations. Examples include monitoring warehouse inventory levels or call center queue wait times to maintain service levels. It answers: "What is happening right now?"
Strategic BI
This approach utilizes historical and aggregate data to inform long-term, high-impact business decisions and plan for future growth. Examples include analyzing multi-year sales trends or market entry studies. It answers: "Where should we be in three years?"
Tactical BI
This bridges the gap between the two, using near-real-time data to optimize mid-term operations and execute specific strategies. For example, evaluating a quarterly marketing campaign’s performance or adjusting production schedules based on regional demand spikes. It answers: "How should we adjust our quarterly execution?"
The Importance of Business Intelligence: Why Your Company Needs It
Understanding the stages and history is secondary to understanding the incredible value BI creates. The importance of business intelligence is amplified because, without it, organizations are flying blind in a data-rich environment. BI transforms uncertainty into calculated risk.
The key benefits include:
Accelerated and Accurate Decision-Making: Instead of relying on gut feelings or incomplete information, executives can access standardized, trustworthy reports. The centralized data and automated reporting structures inherent in BI mean decisions can be made faster and with significantly higher confidence.
Identification of Key Market Trends: BI allows organizations to identify subtle shifts in customer behavior, demand patterns, or competitor performance that would be impossible to spot in fragmented data. Spotting a rising trend early allows for rapid product adaptation and market leadership.
Enhanced Operational Efficiency and Cost Reduction: BI dashboards can immediately highlight bottlenecks in supply chains, overspending in specific departments, or underutilized assets. By optimizing processes, companies can eliminate waste and dramatically improve their bottom line.
Gaining a Competitive Advantage: In an era where most organizations are still struggling to synthesize their data, a company that can leverage comprehensive BI insights can outmaneuver competitors. They can predict customer churn faster, personalize marketing more effectively, and enter new markets more strategically.
Real-World Business Intelligence Examples Across Industries
BI is not limited to a single sector; its power is universal. Here are some compelling Business Intelligence examples showcasing how different industries apply data insights:
Retail: Supply Chain Optimization
A major grocery retailer uses BI to analyze POS (Point-of-Sale) data in real-time, correlated with local weather forecasts and regional events. If a heatwave is forecast for a specific zip code, the BI system automatically flags an increase in demand for beverages and ice cream, adjusting inventory shipments to those specific stores before the shelves go empty. This maximizes sales and prevents stockouts.
Finance: Fraud Detection and Risk Management
A global credit card processor analyzes millions of transactions in real-time. Their BI and advanced analytics engine flags any transaction that deviates significantly from a customer's typical spending location, velocity, or amount. This immediate insight prevents millions of dollars in fraudulent charges before they are settled, protecting both the customer and the institution.
Healthcare: Improving Patient Care and Operational Efficiency
A hospital network uses BI dashboards to monitor patient outcomes, readmission rates, and wait times. By analyzing length-of-stay data across different departments, administrators can identify specific processes (like discharge paperwork) that create bottlenecks. Addressing these inefficiencies allows the hospital to treat more patients effectively, reducing overall costs and improving quality scores.
The Future of BI: What’s Next?
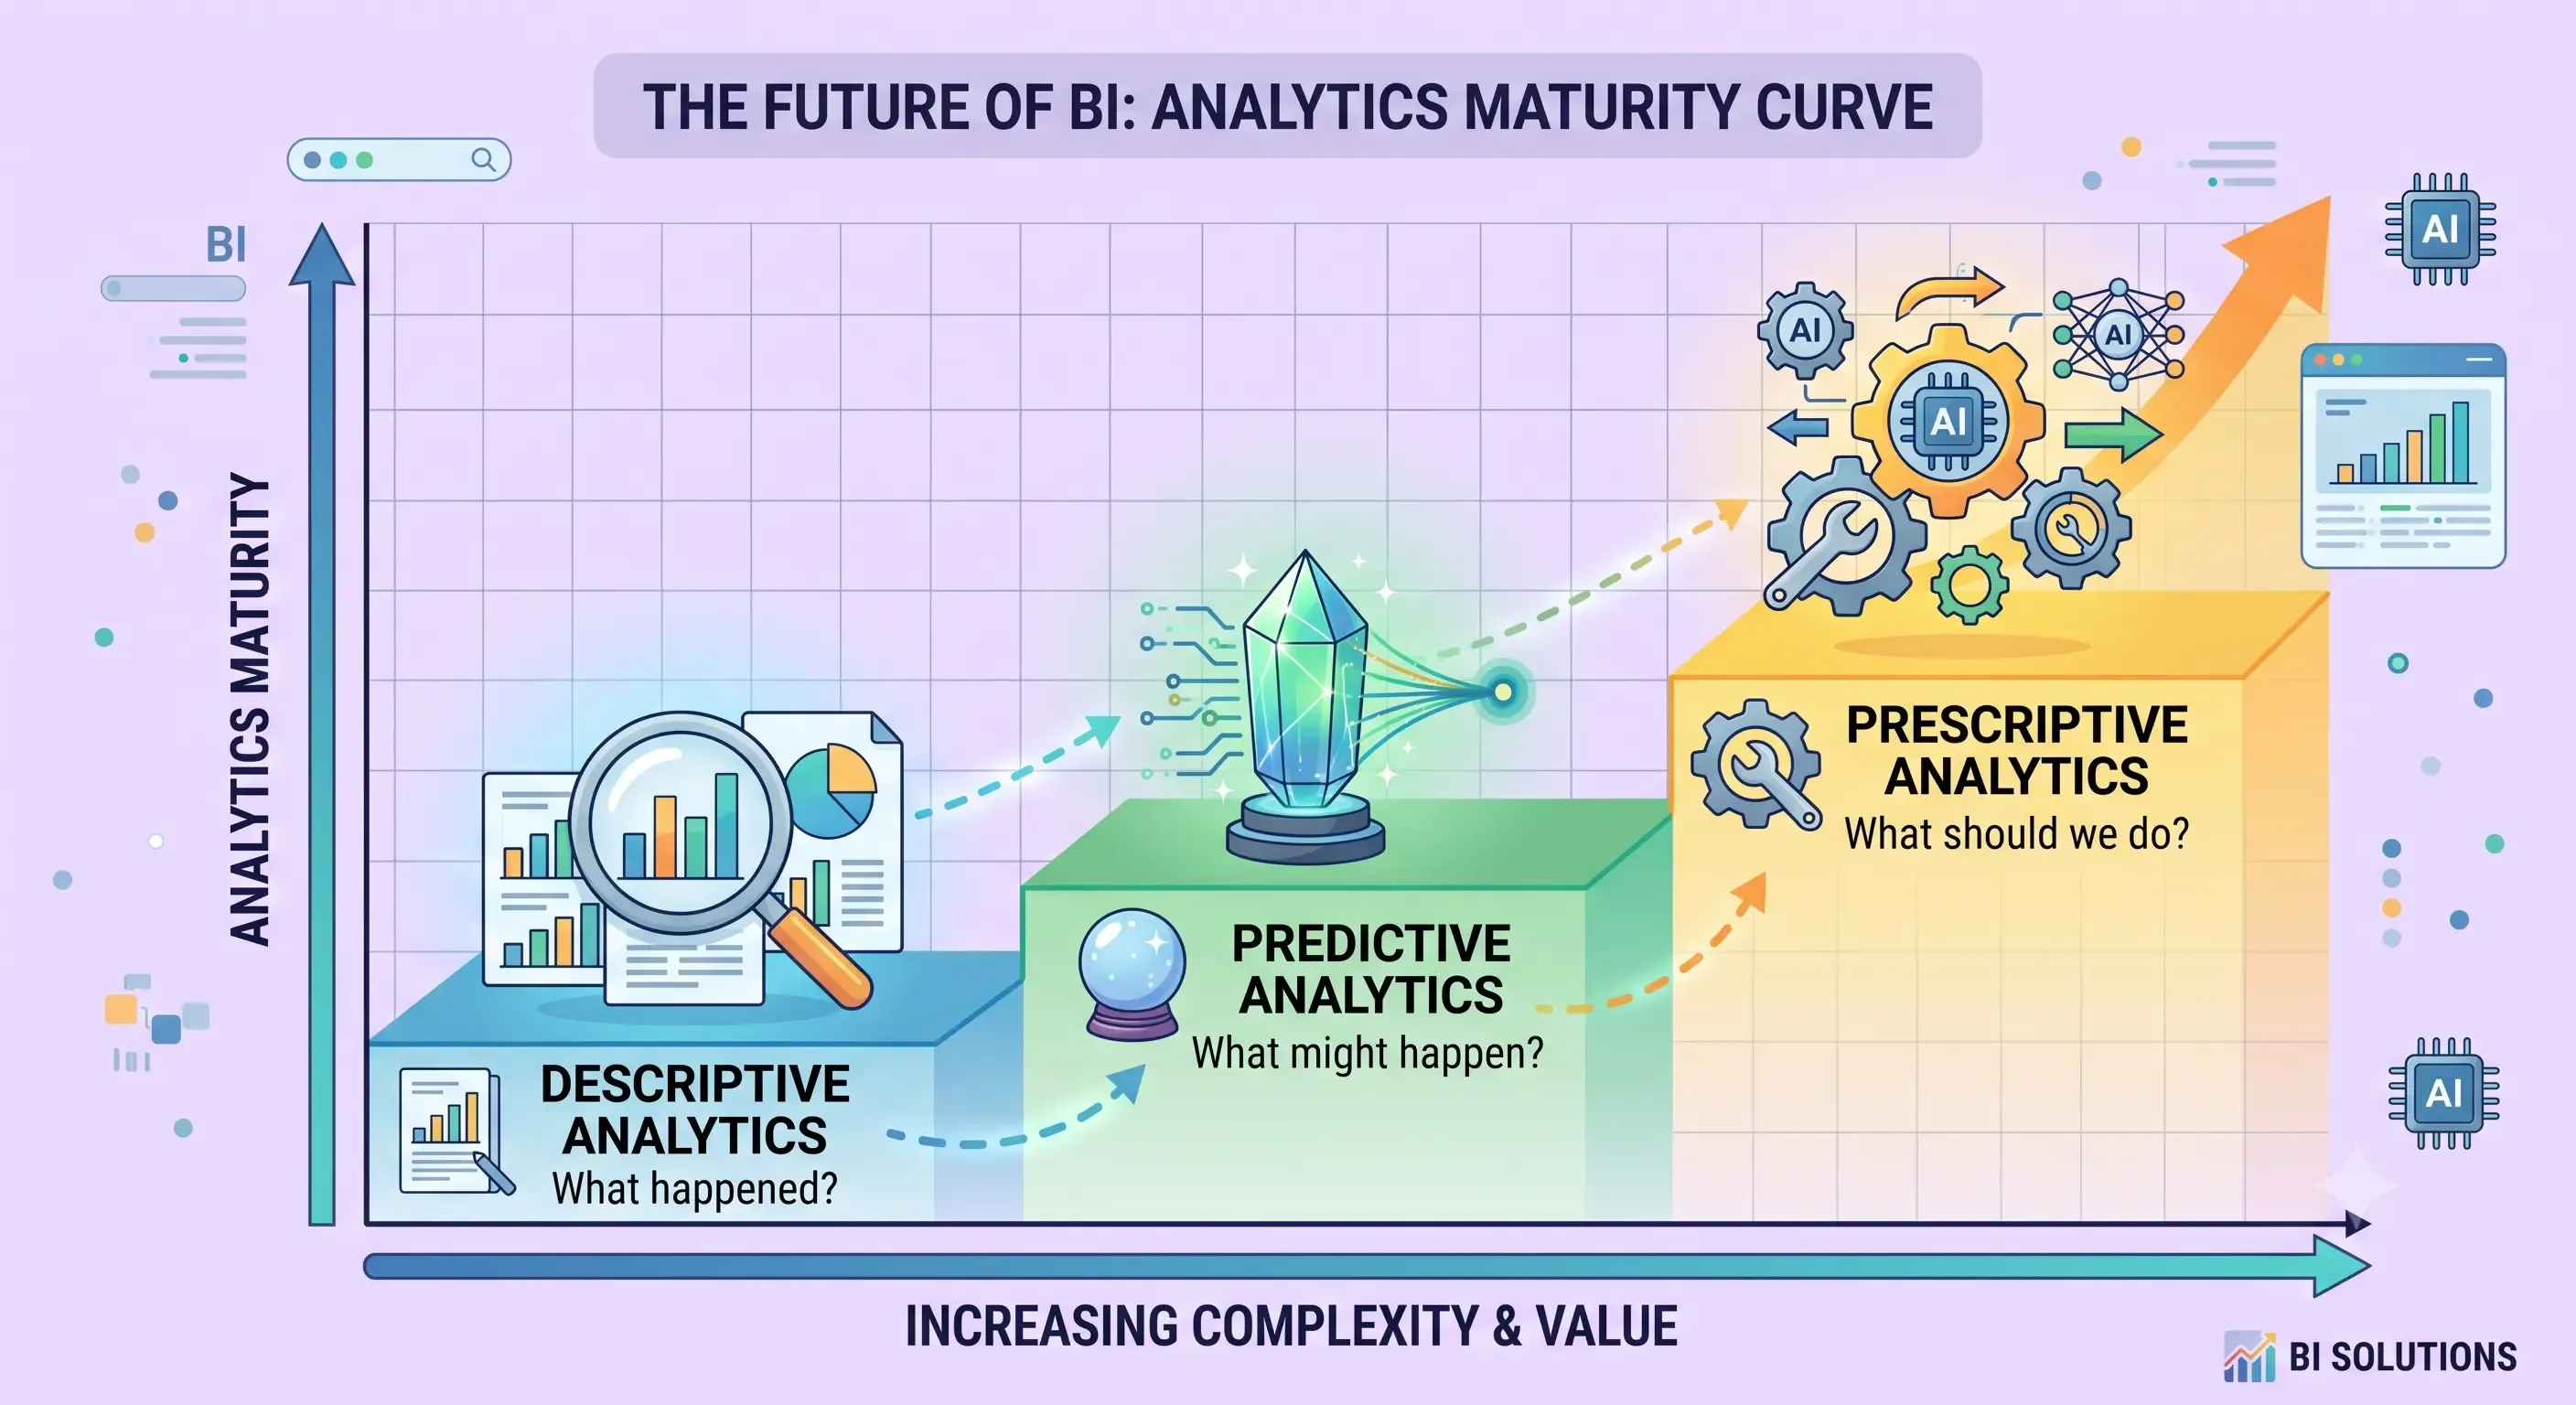
The history of business intelligence showed us the evolution from static reports to dynamic dashboards. The next major leap is the deep integration of Artificial Intelligence (AI) and Machine Learning (ML).
The future will move BI from descriptive (what happened) toward predictive (what might happen) and presumptive (what should we do about what might happen) analytics. AI will assist with automated data preparation, naturally surfacing insights that analysts might miss, and allowing users to ask natural language questions (e.g., "Why were sales down in June?") rather than building a query manually, paving the way for Conversational Analytics.
We will also see the rise of Mobile BI, with dashboards optimized for immediate consumption on smartphones, and Embedded BI, where insights are integrated directly into operational applications like CRMs or project management tools, putting analytics exactly where the work is done.
Conclusion: Becoming a Data-Driven Organization
We have covered the extensive landscape of what is business intelligence, from its architectural backbone to the strategic benefits and the industry leaders defining the field. BI is no longer a luxury; it is a fundamental survival requirement in a competitive market.
To move from having data to having ‘intelligence,’ organizations must understand how business intelligence works, follow the necessary 5 stages of business intelligence, from gathering to action, and invest in the correct culture and tools. The benefits such as better decisions, competitive edge, and operational efficiency are quantifiable and transformational.