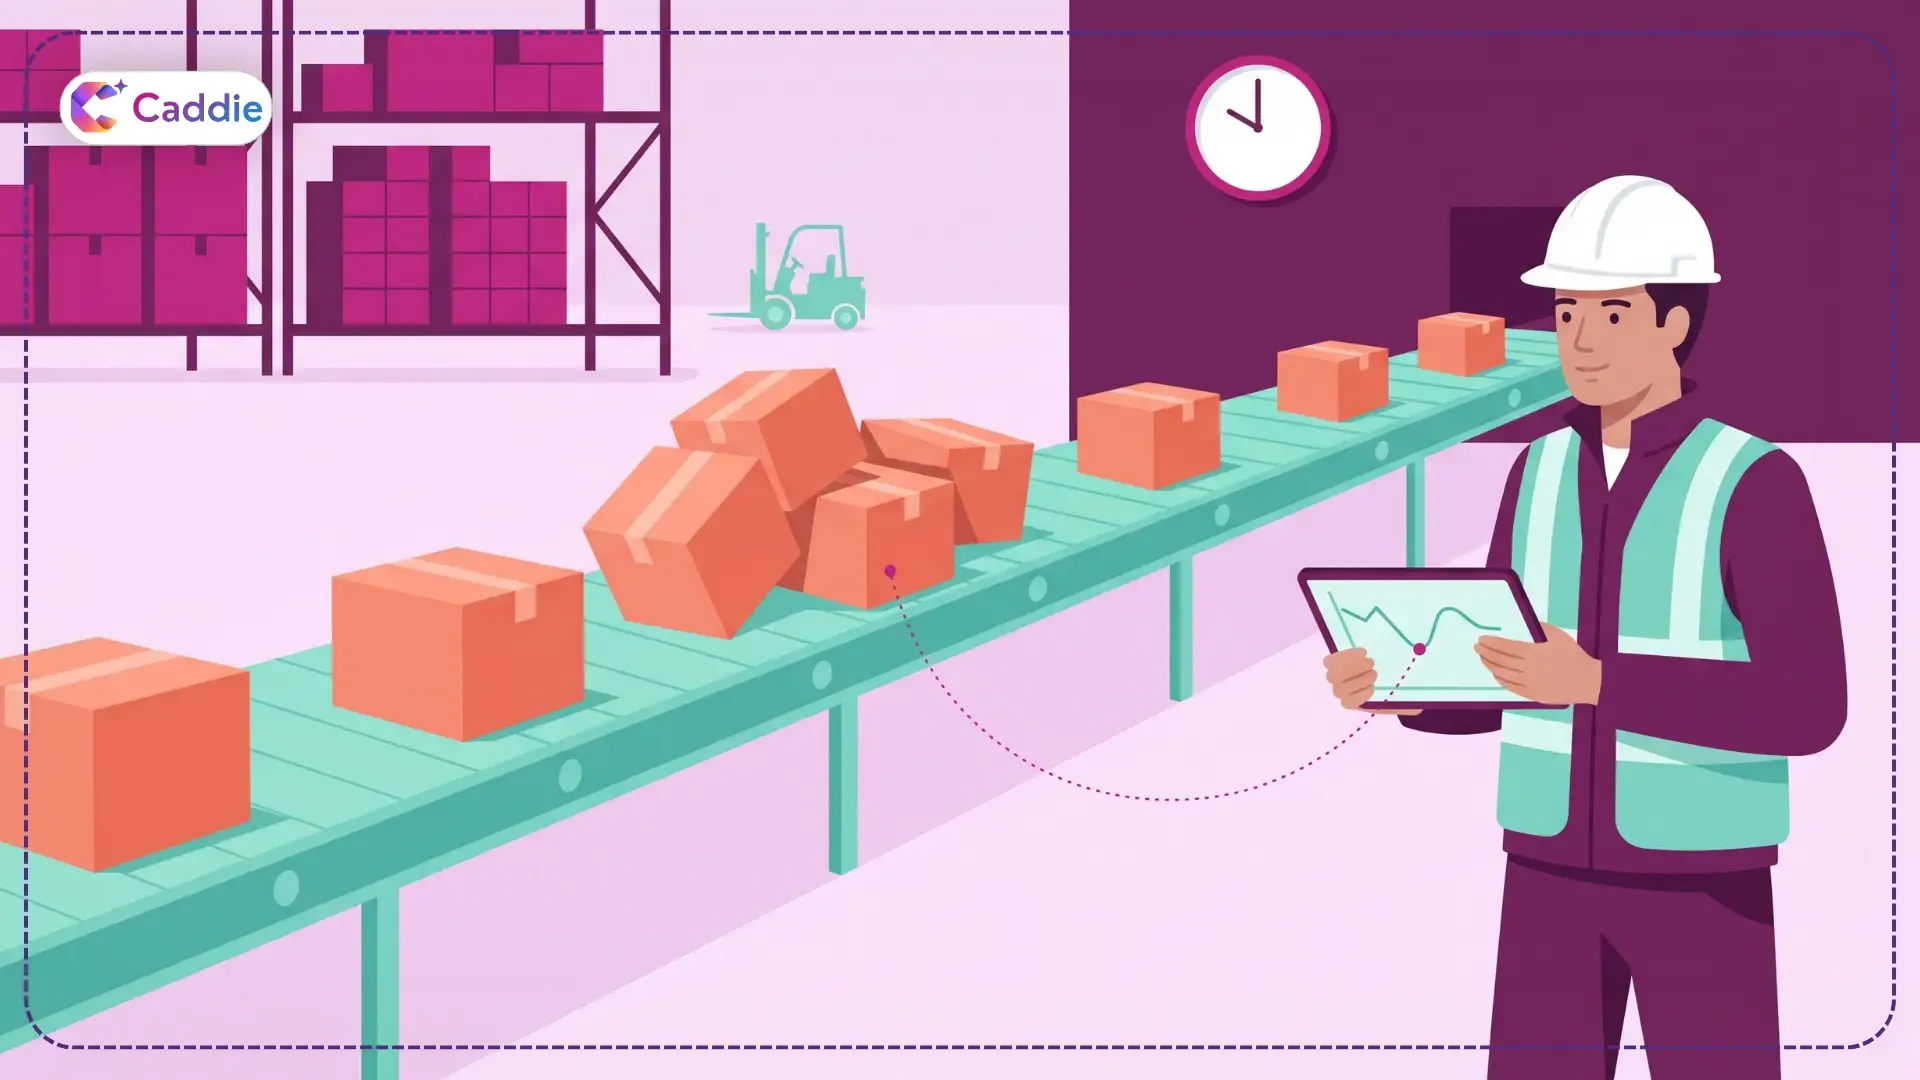
It’s 10 a.m., and a line in your plant is running slow. Or a regional warehouse is short on pickers for the afternoon wave. Or support tickets just doubled after a product update. You don’t need a quarterly review to tell you something is off. You need to know what’s happening, why it’s happening, and what to do about it before the shift ends.
That’s the job of operational analytics. It turns the data your daily operations already produce into answers you can act on while they still matter. In this guide, you’ll learn what operational analytics is, how it differs from traditional BI and reporting, how ops teams use it day to day, and how to build a practice your managers will actually use.
What Is Operational Analytics?
Operational analytics is the practice of analyzing data from your day-to-day business operations to improve how work gets done right now. Instead of looking back at last quarter, it focuses on the current shift, today’s orders, and this week’s capacity.
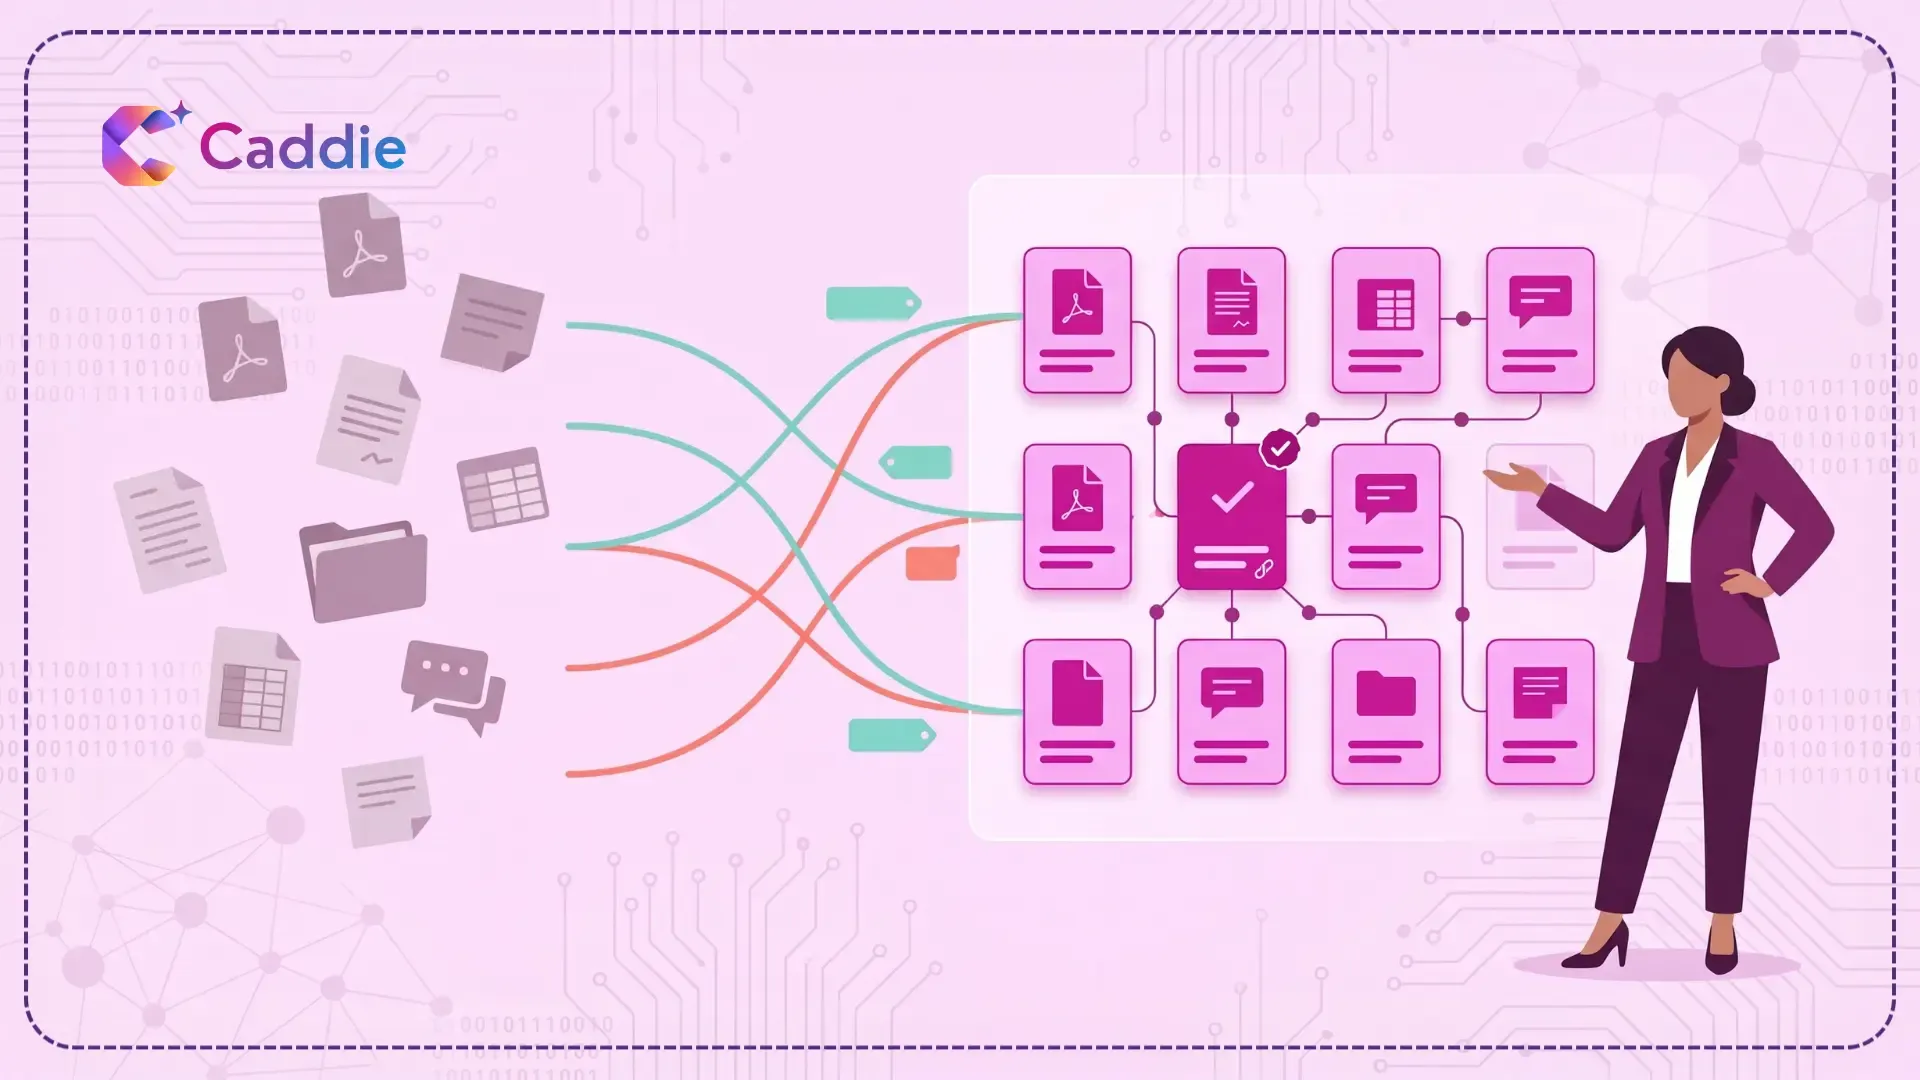
It draws on operational data, which is the record your systems create as work happens. Think order and inventory records in your ERP, machine readings from the shop floor, tickets in your service desk, shipment scans from logistics partners, and schedules from your workforce tools. It also covers the documents your operations run on, like SOPs, vendor contracts, and maintenance logs.
What makes operational data analytics distinct is who uses it and when. The users are usually ops managers, supervisors, and team leads rather than analysts. And the answers need to arrive inside the decision window, whether that’s the next hour or the next planning meeting. That’s why operations analytics is so closely tied to everyday operational decision making.
You’ll also hear the term operational intelligence. It usually refers to continuous monitoring of live events with alerts. Operational analytics is broader. It includes monitoring, but it also covers investigating why something happened and deciding what to change.
Operational Analytics vs. Business Intelligence
Traditional business intelligence is built for strategic questions. How did revenue trend this year? Which product lines grew? It works on cleaned, historical data that leadership usually reviews on a weekly or monthly cadence.
Operational analytics answers a different set of questions. Which orders are at risk of missing today’s ship window? Why is first-pass yield down on line 3? Where is the backlog building? The data is fresher, the questions are narrower, and the people asking are closer to the work.
The two aren’t rivals. BI tells you where the business is heading. Operational analytics helps you steer each day of the trip.
Operational Reporting vs. Analytics
Operational reporting tells you what happened: 412 orders shipped, 18 tickets breached SLA, six hours of downtime. It’s essential, but it stops at the number. Analytics asks the follow-up. Which customers did those SLA breaches affect? Did the downtime cluster on one machine or one shift? Reporting gives you the scoreboard. Analytics shows you how to change the score.
Why Ops Teams Can’t Afford to Wait on Data
Most operations teams aren’t short on data. They’re short on usable data at the moment they need it. Information sits across ERP, MES, ticketing tools, spreadsheets, and shared drives, and someone has to stitch it together before anyone can act.
That stitching has a real cost. In an L2L survey of 600+ manufacturing leaders, nearly two-thirds of frontline supervisors said they spend at least an hour per shift cleaning and reconciling data, and only 9% of organizations can identify root causes in real time.
The upside is just as clear. In Dayforce’s 2026 frontline research, 74% of executives and managers said many shift-level disruptions are at least moderately avoidable with better real-time information.
That’s the gap real-time operational analytics closes. Static dashboards refreshed overnight can show you yesterday’s problem. They can’t help you prevent today’s.
How Ops Teams Use Operational Analytics: 6 Use Cases
Here’s where operational analytics shows up in a typical week. These use cases cut across industries, so you’ll probably recognize a few from your own operation.
1. Spot Bottlenecks Before They Spread
When throughput dips, you need to see where work is piling up. Comparing cycle times by station, shift, or team helps you find operational bottlenecks early, so you can move people or capacity before a slowdown turns into missed deliveries.
2. Keep Inventory and Supply in Balance
Stockouts and overstock both cost you money. By tracking fill rates, supplier lead times, and demand by location, your supply chain team can rebalance stock across sites and flag late suppliers while there’s still time to expedite.
3. Plan Staffing Around Real Demand
Labor is often your biggest controllable cost. Matching schedules to actual order volume, ticket inflow, or foot traffic helps you avoid paying overtime on slow days and running short on busy ones.
4. Catch Quality Issues at the Source
A rise in defects or returns rarely happens at random. Linking quality data with batch, supplier, machine, and operator data helps you trace a problem to its source instead of inspecting your way out of it.
5. Track Service Levels as They Happen
For service and support operations, operational metrics like first-response time, backlog age, and SLA attainment matter most during the day, not at month-end. Watching them live lets you reassign work before breaches stack up.
6. Find Answers Buried in Documents
Not every operational question lives in a database. What’s the penalty clause in your carrier contract? What does the SOP say about this alarm code? Answers like these sit in PDFs and policies, and modern tools let your team query them alongside structured data.
How to Build an Operational Analytics Practice
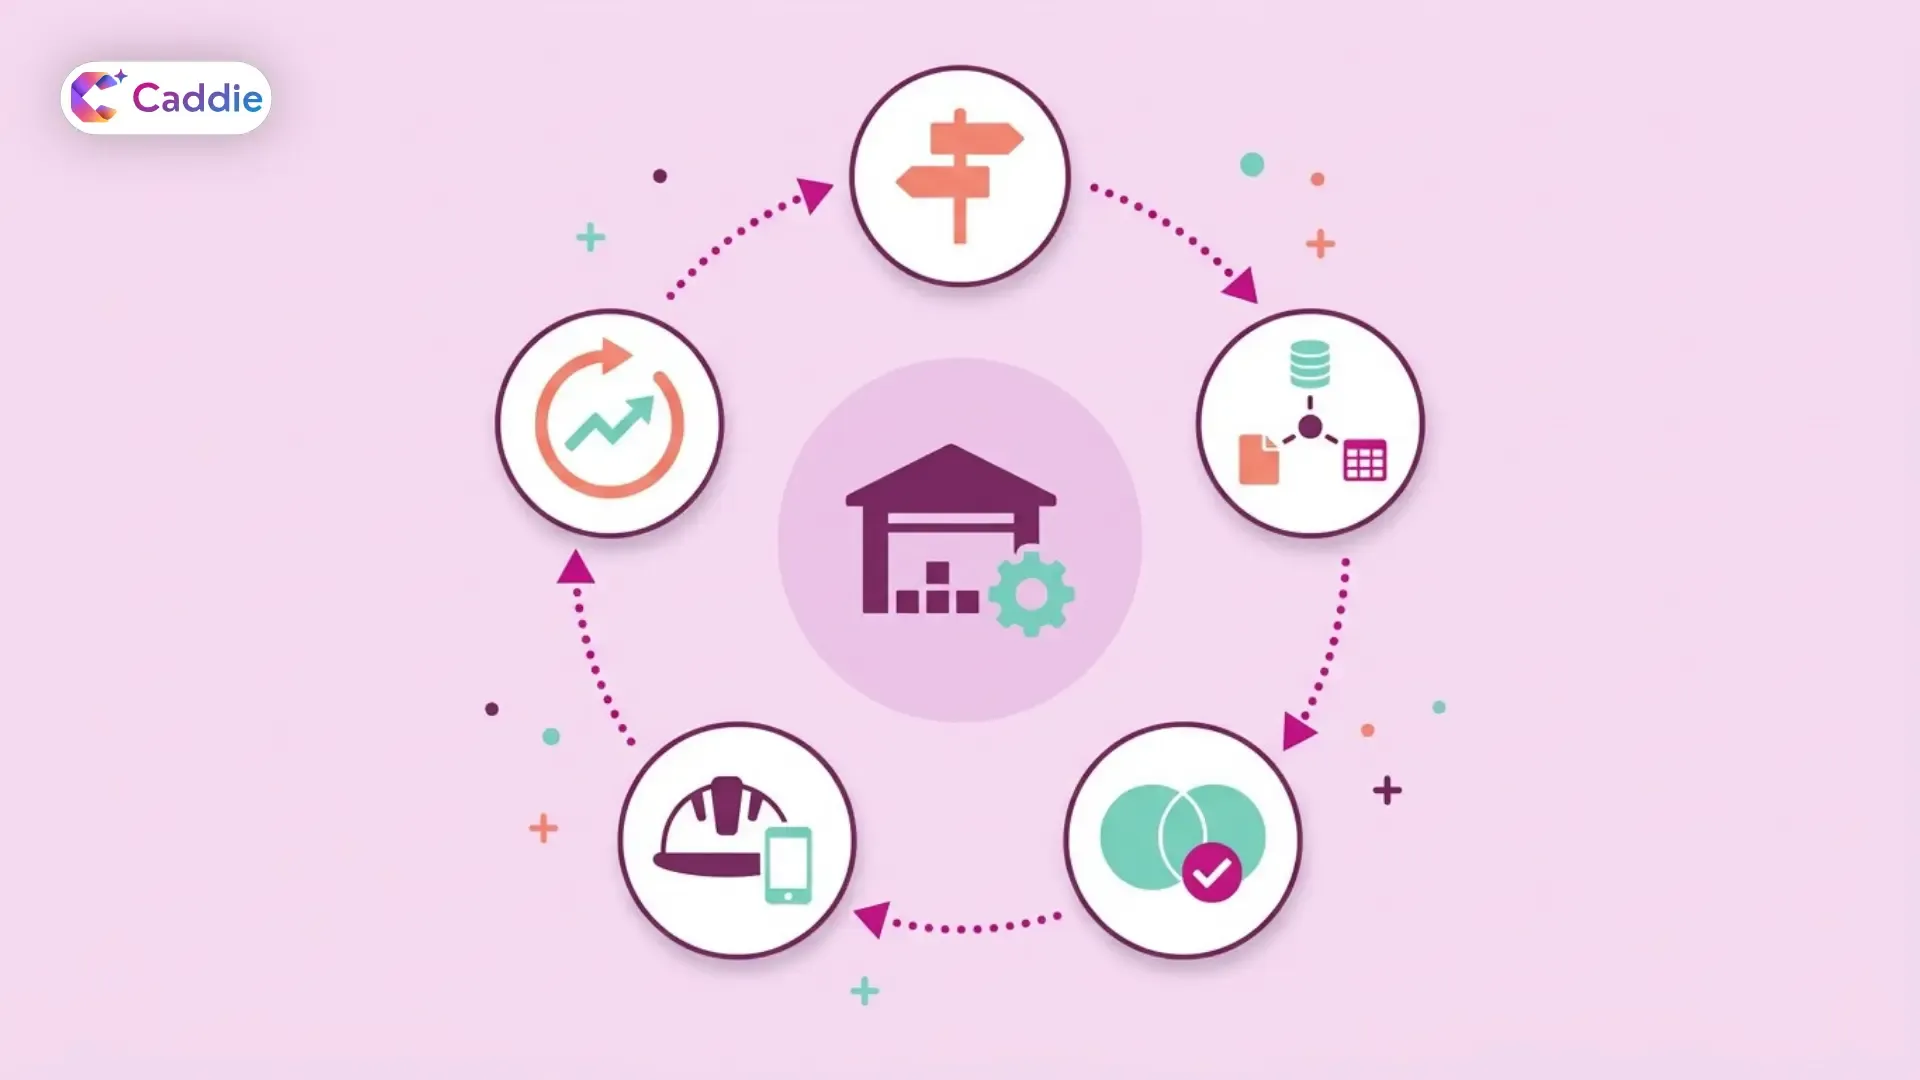
Buying a tool is the easy part. Here’s how to make operational analytics stick and turn it into lasting operational efficiency.
Start With Decisions, Not Data
List the recurring decisions your ops team makes, such as reorder, reschedule, escalate, or reroute. For each one, note the question behind it and the data that answers it. This keeps you focused on the handful of measures that actually drive action. If you already practice KPI analytics, map your operational metrics to it so daily work ties back to strategic goals.
Connect Your Operational Data Sources
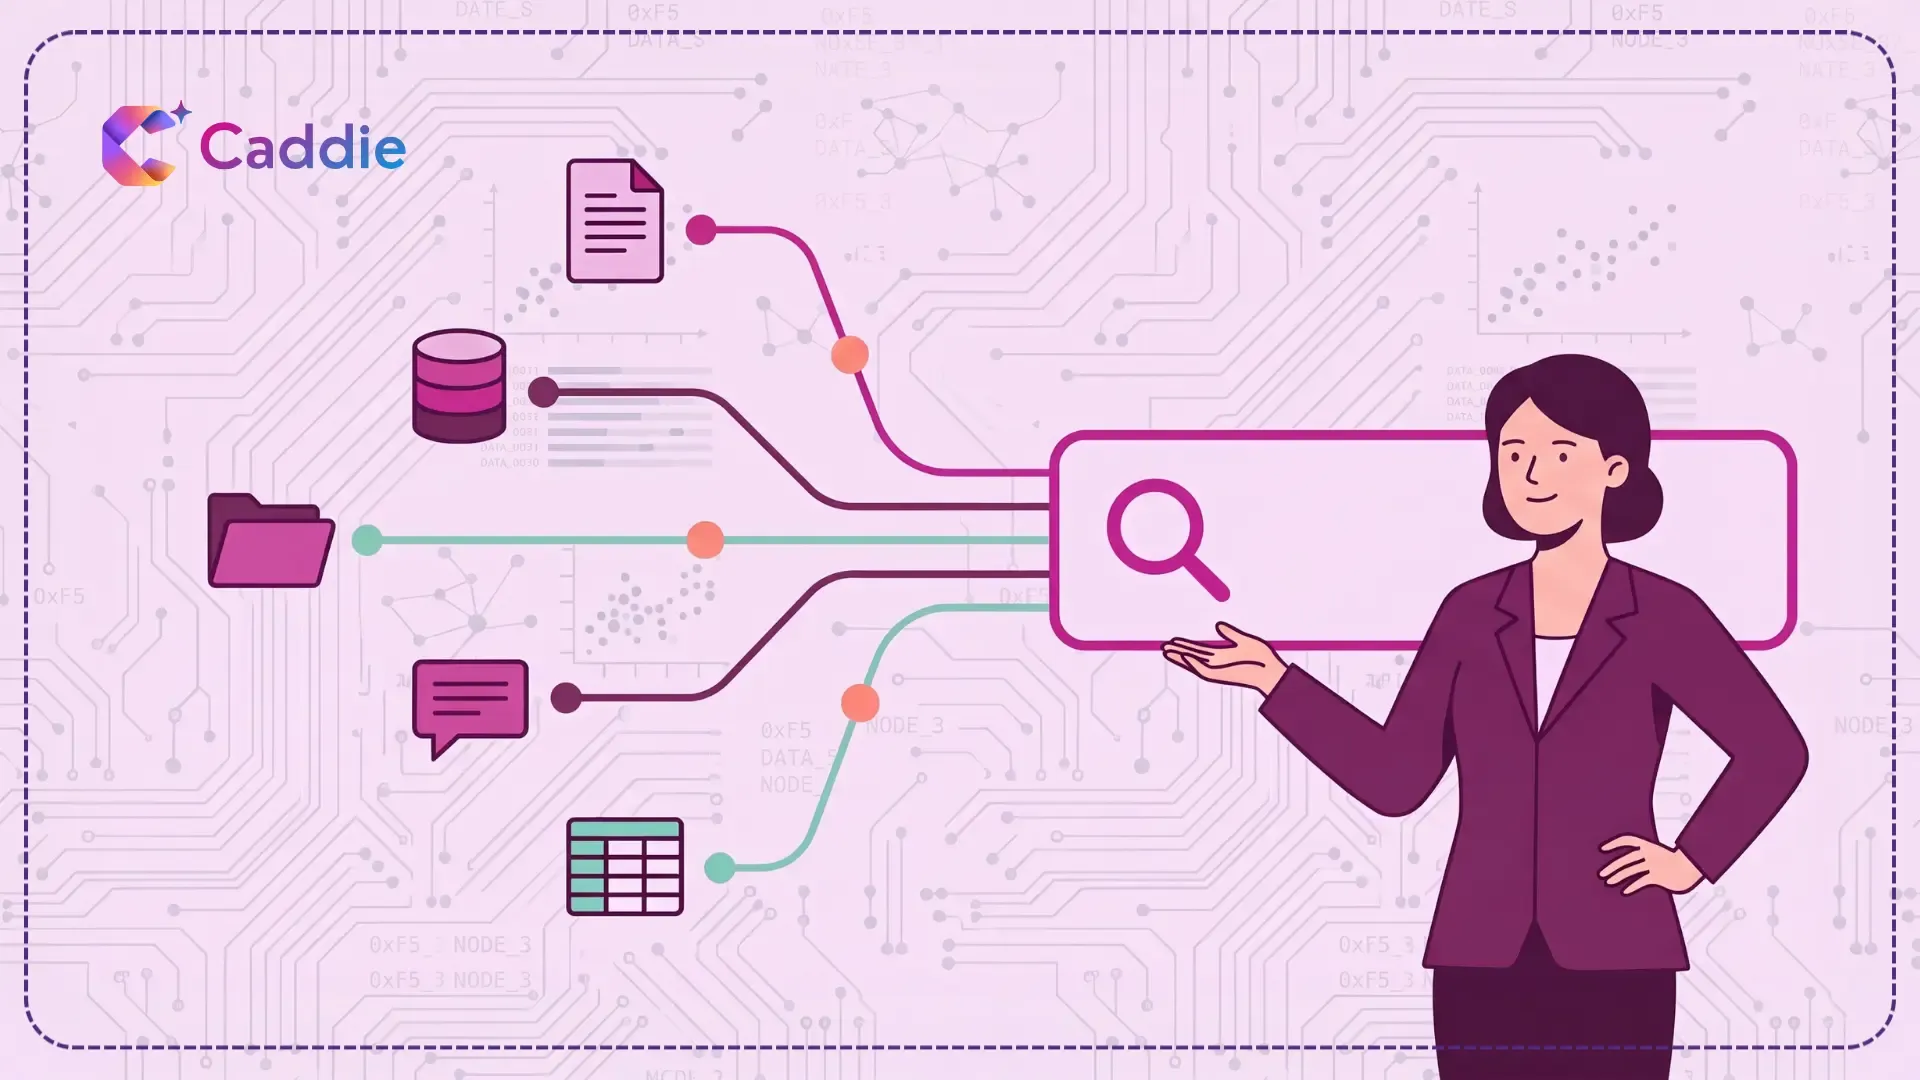
Bring your ERP, CRM, ticketing, workforce, and spreadsheet data into one place you can query, ideally through live connections rather than nightly extracts. The fewer copies you keep, the fewer arguments you’ll have about which number is right.
Agree on Metric Definitions
“On-time” can mean shipped by the promised date or delivered by it. Settle definitions for your core metrics once and enforce them everywhere. Sound data governance, including role-based access, keeps answers consistent and keeps sensitive data with the right people.
Put Answers in Frontline Hands
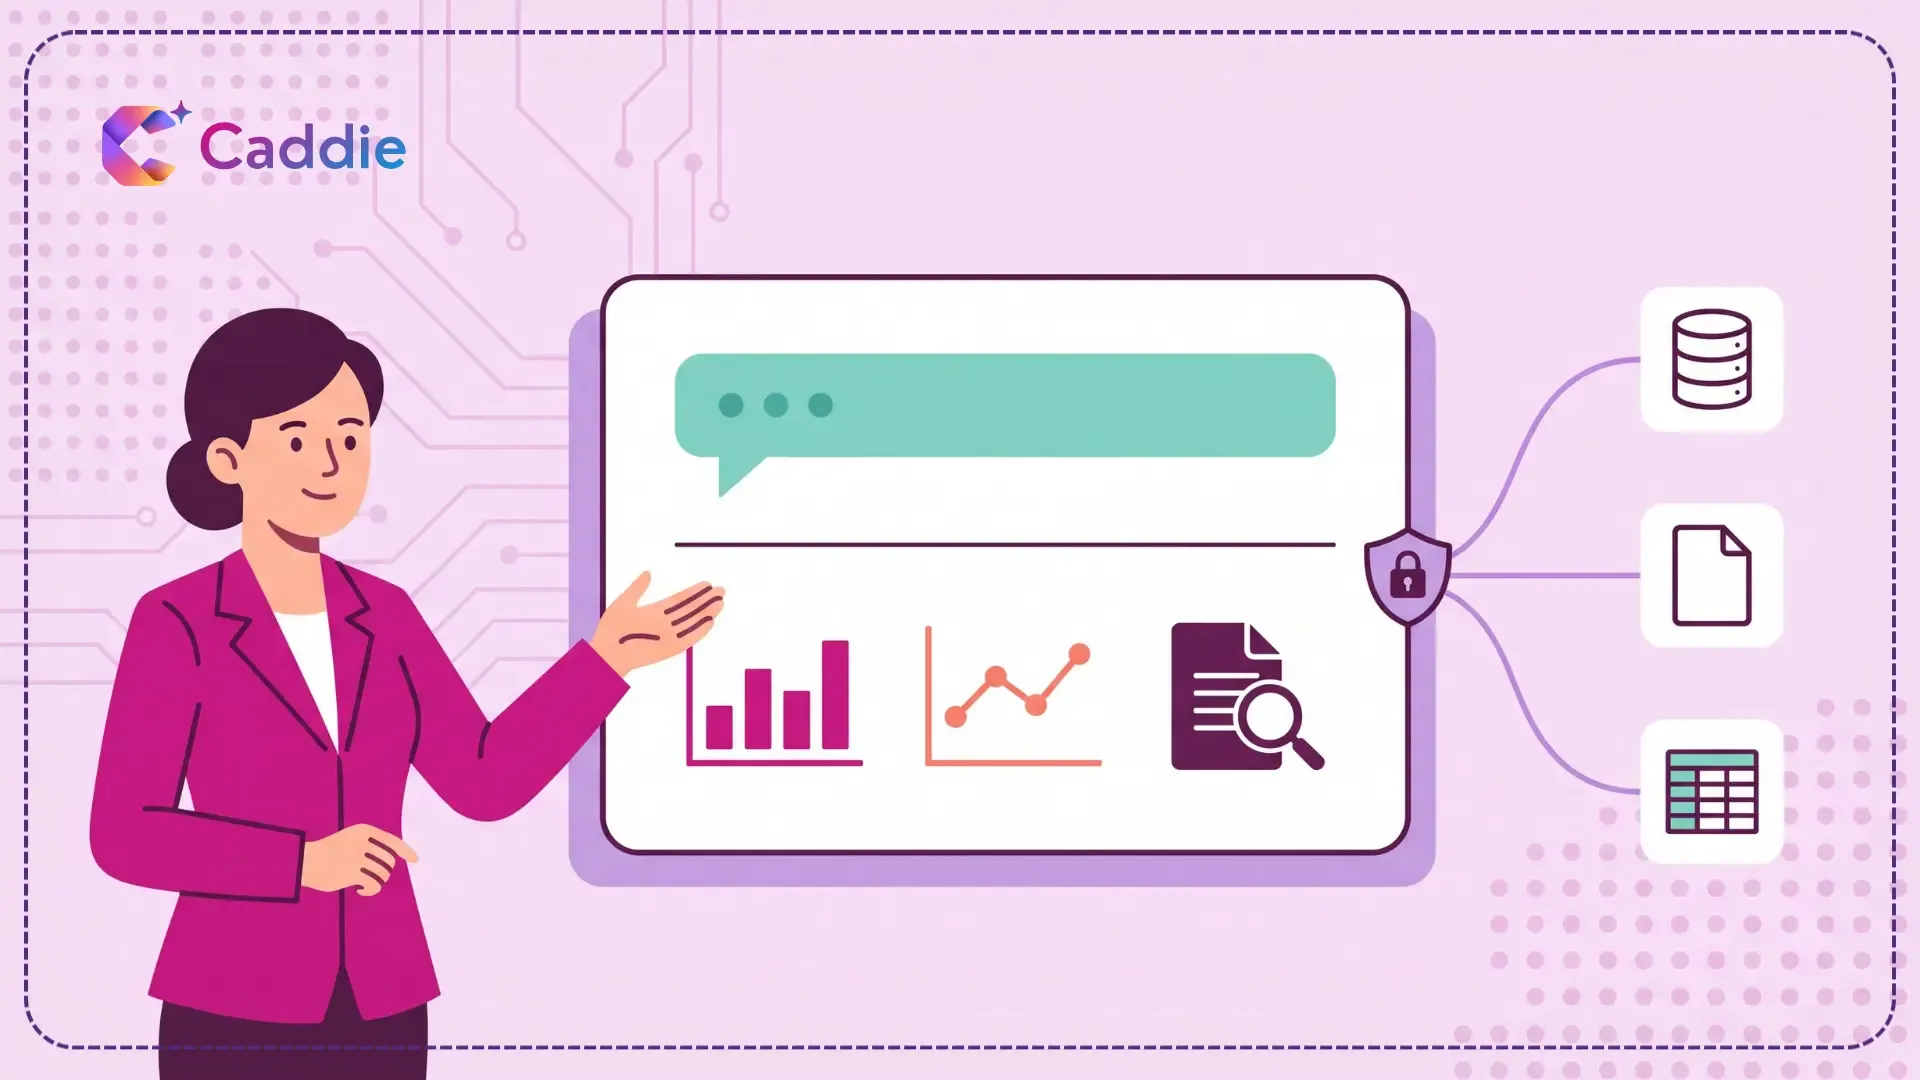
Your supervisors won’t file a ticket and wait two days in the middle of a shift. Give them self-service analytics with a natural language query interface, so they can ask “Which orders are late in the east region?” and get an answer they can check, with the source behind it, at a desk or on a phone. For the harder follow-up, why those orders are late, agentic analytics goes further: AI agents run the analysis across your connected systems, follow the drivers, and check their results before answering.
Close the Loop
Track what you changed and whether it worked. Did the new schedule cut overtime? Did the backup supplier hit its lead times? Feeding outcomes back into your next decision is what turns operational analytics from monitoring into continuous improvement.
What to Look For in Operational Analytics Tools
When you compare operational analytics tools, look past the polished operations dashboard in the demo and check for these essentials:
- Live connections to your operational systems, not just scheduled refreshes
- Coverage for both structured data and documents like SOPs and contracts
- Plain-language questions, with follow-ups that keep context
- Role-based access, SSO, and MFA, so the right people see the right data
- Mobile access for managers who spend their day on the floor
- Easy sharing and export, so an insight reaches the team that needs to act
- Traceable answers that show which source and filters produced each number
- Investigation, not just retrieval, so the tool can work out why a metric moved across systems
- Honest limits, so the tool says when the data can’t support an answer instead of guessing
How Caddie Supports Operational Analytics
Caddie is an AI-powered analytics platform for operations whose data lives in many systems. It connects to what you already run, including your ERP, operational databases, spreadsheets, and the SOPs, contracts, and maintenance logs your operations depend on, and builds one map of your data in the terms your team already uses. When line 3 slows at 10 a.m., Caddie’s agents do the groundwork: they run the analysis, follow the drivers, and check their own results. When the data can’t support an answer, Caddie says “not yet” instead of guessing. Supervisors can ask from the floor through the mobile app or by voice, then share findings by email or WhatsApp or export them to PDF and Excel, with SSO, MFA, and role-based access control keeping every answer governed. Your managers get the reasons, the sources, and the next steps in one place, before the shift ends. They make the call.
Give your ops team answers at the speed of the shift. Book a Caddie demo.
Frequently Asked Questions
What is operational analytics?
Operational analytics is the practice of analyzing data from day-to-day operations, such as orders, inventory, machines, and tickets, so teams can improve processes and make faster decisions while they still matter.
What is an example of operational analytics?
A warehouse manager comparing pick rates by shift, spotting an afternoon slowdown, and moving staff before orders miss the carrier cutoff is a classic example of operational analytics in action.
How is operational analytics different from business intelligence?
Business intelligence focuses on historical, strategic questions for leadership. Operational analytics uses fresher data to answer narrow, day-to-day questions for the managers and teams running processes right now.
What is the difference between operational analytics and operational intelligence?
Operational intelligence focuses on monitoring live events and triggering alerts. Operational analytics is broader, covering monitoring plus investigating root causes and deciding which process changes to make next.
What should you look for in operational analytics tools?
Look for live data connections, document coverage, plain-language questions, role-based access, mobile support, easy sharing, and traceable answers that show exactly where each number came from in your data.