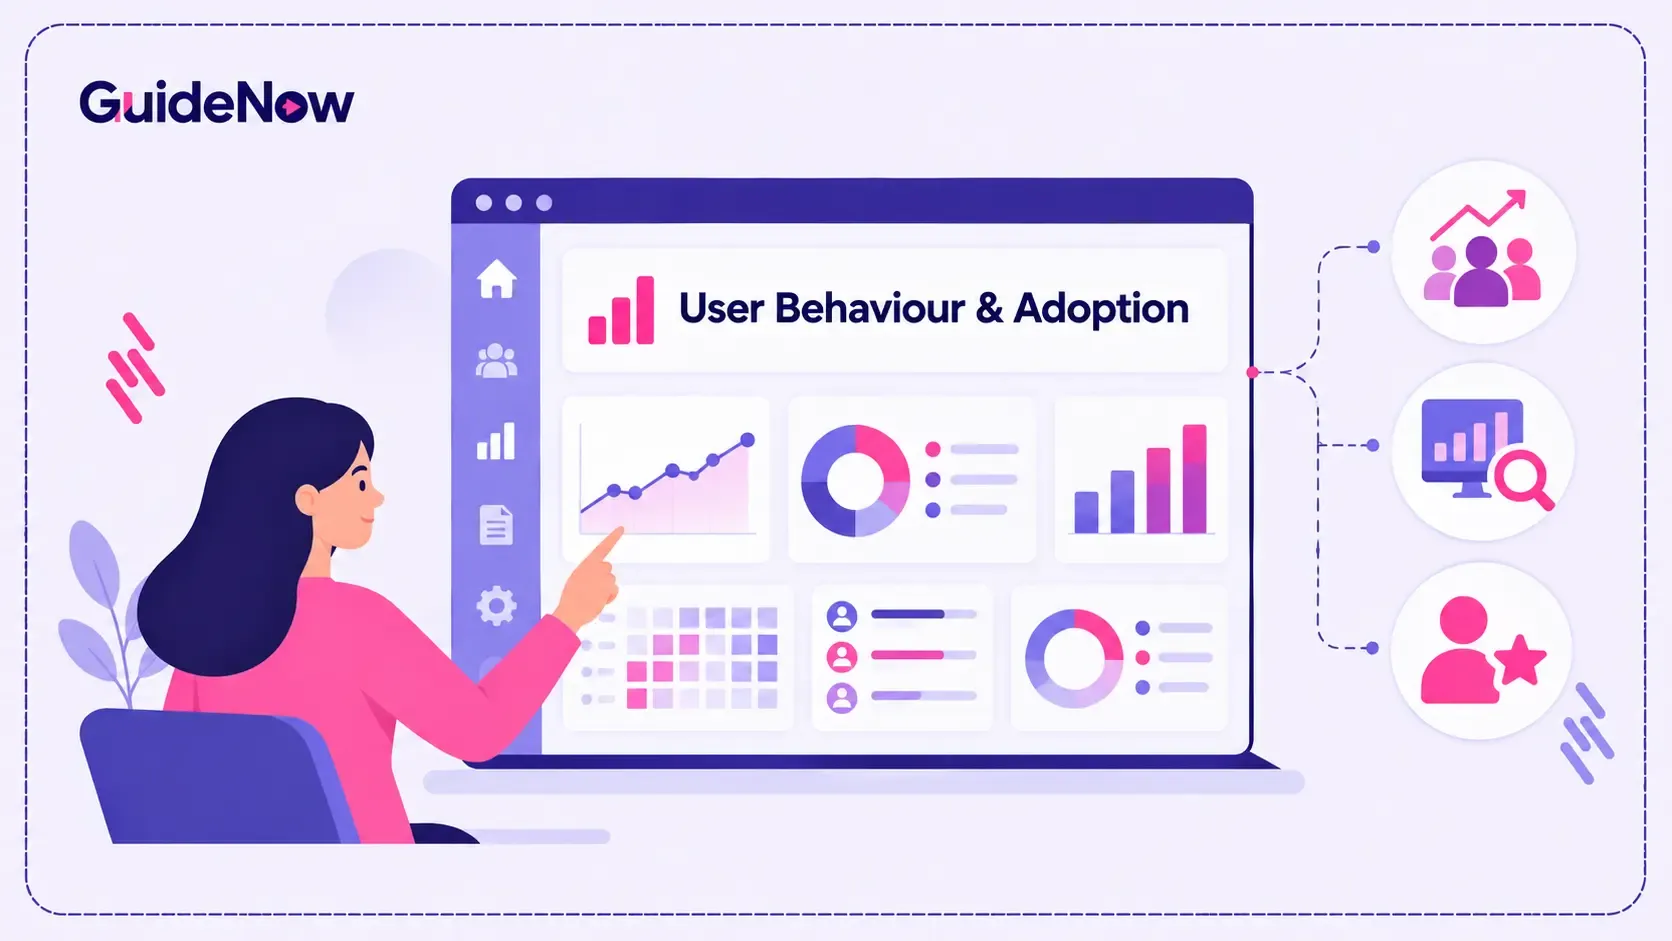
Choosing software is only the first step toward digital adoption. Businesses also need to understand how users interact with applications, which features they use, where they encounter friction, and whether in-app guidance improves software usage.
An AI analytics dashboard for user adoption helps teams analyze these patterns and make better decisions about software adoption. Depending on the platform, it can provide behavioral analytics, funnel reports, engagement data, guide performance metrics, and AI-assisted insights.
However, not every analytics platform measures the same things. Digital adoption platforms focus on in-app guidance and enterprise software usage, while product analytics tools specialize in event tracking, user journeys, and feature adoption.
This guide compares eight platforms to help product managers, IT leaders, digital adoption managers, and customer success teams identify the right solution for tracking user behavior, evaluating guidance effectiveness, and connecting adoption data to business outcomes. Understanding the technology adoption curve can also help businesses evaluate how users adopt new software over time and identify opportunities to improve adoption.
8 Best AI Dashboards for Tracking User Behavior and Adoption ROI
1. GuideNow by VividMinds
Best for: In-app guidance and enterprise software adoption analytics
Overview
GuideNow is an AI-powered digital adoption platform that helps users navigate software through contextual guidance, interactive experiences, and AI assistance. Its analytics dashboard is designed to provide insights into user behavior and adoption patterns.
GuideNow is relevant to organizations that want to combine user enablement with adoption measurement rather than rely exclusively on a standalone product analytics tool.
Key features
- AI-assisted creation of onboarding content, tours, visuals, and workflows.
- Contextual in-app guidance and interactive product tours.
- Analytics dashboard for user behavior and adoption patterns.
- Guidance experiences such as tooltips, checklists, banners, and tours.
- No-code deployment positioning for application guidance.
Adoption analytics
GuideNow's public product page describes real-time insights into user behavior, areas where users succeed or struggle, adoption progress, and journey optimization.
However, the exact availability of guide completion-rate reports, step-level funnels, custom event tracking, and AI-generated analytics summaries is not fully specified publicly. Buyers should verify these capabilities during a demonstration.
ROI measurement
GuideNow positions its analytics around adoption improvement and ROI measurement. Organizations should confirm which outcomes can be reported directly and which require data from support, training, or enterprise systems.
2. Whatfix
Best for: Enterprise application behavior and in-app guidance analytics
Overview
Whatfix offers a digital adoption platform alongside a Product Analytics solution. Its approach is particularly relevant to organizations that need to understand both user behavior inside applications and engagement with in-app guidance.
Key features
- No-code product analytics and event capture.
- User journey, funnel, and engagement analysis.
- Session replay and AI-assisted behavioral insights.
- Guidance Analytics for Flows, Smart Tips, Pop-Ups, and Task Lists.
- Dashboards for evaluating product behavior and guidance engagement.
Adoption analytics
Whatfix distinguishes between Product Analytics, which examines application interactions, and Guidance Analytics, which measures engagement with in-app experiences.
Its guidance analytics documentation describes reporting on Flow completions, Task List completions, Pop-Up engagement, Smart Tip views, and Self Help usage. This makes it a relevant option for teams specifically evaluating in-app guide completion tracking.
ROI measurement
Teams can investigate workflow abandonment, identify underused features, and evaluate whether guidance improves task completion. Training savings and reduced support costs should be validated using additional operational data.
3. WalkMe
Best for: Enterprise adoption analytics and complex application workflows
Overview
WalkMe helps enterprises understand how employees interact with business applications and in-app guidance. Its analytics capabilities support workflow analysis, user engagement measurement, and investigation of adoption barriers.
Key features
- Flow Analytics for understanding user journeys.
- Funnel and path analysis.
- Behavioral segmentation and custom dashboards.
- AI-assisted insights.
- Application usage and software utilization analysis.
Adoption analytics
WalkMe is suited to teams that need to investigate where users abandon workflows, whether employees engage with guidance, and which application processes require improvement.
During evaluation, confirm the availability of individual guide completion events, step-level reporting, and comparisons between guided and unguided users.
ROI measurement
Organizations can use workflow and usage data to identify opportunities to improve task efficiency and software utilization. To quantify ROI, combine these findings with measured task times, training expenses, and support costs.
4. Pendo
Best for: Product analytics combined with in-app guides
Overview
Pendo combines product analytics, in-app guidance, and feedback capabilities. It helps product teams understand user behavior and improve how customers discover and use product features.
Key features
- Product usage analytics and dashboards.
- In-app guides for onboarding and feature discovery.
- Session replay on eligible plans.
- User segmentation and journey analysis.
- AI capabilities for product insights and analysis.
Adoption analytics
Pendo can help teams examine feature usage, engagement, and user journeys while evaluating interactions with in-app guides. Confirm the exact guide completion reports and reporting limits available under the selected plan.
ROI measurement
Product teams can compare adoption and engagement before and after changes to onboarding experiences. Retention, support costs, and revenue impact require appropriate outcome data and attribution.
5. Userpilot
Best for: SaaS onboarding and feature adoption analytics
Overview
Userpilot combines in-app engagement tools with product analytics. It helps SaaS teams create onboarding experiences, segment users, and understand how people interact with product features.
Key features
- In-app flows and onboarding checklists.
- User segmentation and usage trends.
- Funnel and retention analysis on eligible plans.
- Event autocapture on the Growth plan.
- AI Agent Lia for questions about product data and guide creation.
Adoption analytics
Userpilot helps teams analyze onboarding engagement, product usage, feature adoption, and retention. Its combination of in-app engagement and analytics is useful for assessing whether onboarding improvements are associated with stronger activation.
Verify the exact guide completion reporting available for your intended use case.
ROI measurement
SaaS teams can evaluate activation, feature adoption, and retention trends following onboarding changes. Financial ROI requires additional data on support expenses, revenue, or productivity.
6. Mixpanel
Best for: Event-based analytics, funnels, and retention
Overview
Mixpanel is a product analytics platform that helps teams understand how users interact with web and mobile applications. Its primary strength is behavioral analysis rather than creating and managing enterprise in-app guidance.
Key features
- Event-based user behavior tracking.
- Funnel and retention analysis.
- Cohort analysis and segmentation.
- Product analytics dashboards.
- Session replay and behavioral reporting.
Adoption analytics
Teams can define events for onboarding milestones, feature usage, and task completion. Funnel reports reveal where users abandon a process, while retention reports help evaluate whether users return.
Guide completion can be measured when the relevant event is instrumented or supplied through an integration.
ROI measurement
Mixpanel helps teams connect product behavior with activation, retention, and conversion. Measuring training savings or reduced support costs requires additional operational data.
7. Amplitude
Best for: Behavioral analytics, user journeys, and experimentation
Overview
Amplitude provides product analytics, session replay, experimentation, and AI-assisted capabilities. It helps teams investigate user journeys and identify behavioral patterns associated with activation and retention.
Key features
- Event-based behavioral analytics.
- Funnels, cohorts, and retention analysis.
- Session replay and experimentation.
- AI-assisted product analysis.
- Guides and surveys, with availability depending on plan.
Adoption analytics
Amplitude can track onboarding milestones, feature usage, and conversion through defined user journeys. Guide completion can be measured when relevant events are captured, but dedicated enterprise DAP functionality should not be assumed.
ROI measurement
Teams can analyze activation and retention trends and evaluate changes through experiments. Financial impact requires linking behavioral findings to business outcomes.
8. Heap
Best for: Discovering behavioral friction and analyzing user journeys
Overview
Heap is a product analytics platform designed to help teams investigate user behavior through funnels, journeys, and session replay. It is particularly useful when teams need to understand where users struggle during important product interactions.
Key features
- Behavioral and event-based analytics.
- Funnel and journey analysis.
- Session replay capabilities.
- AI-powered analysis on eligible plans.
- Analytics reports and user segmentation.
Adoption analytics
Heap can analyze onboarding events, feature usage, and user journey completion. Session replay helps teams investigate the behavior behind a drop-off.
Guide completion requires suitable event capture or integration with the in-app guidance platform.
ROI measurement
Teams can identify opportunities to improve conversion, activation, and task completion. Training savings and productivity gains require additional business data.
Comparison Table: Best Adoption Analytics Platforms
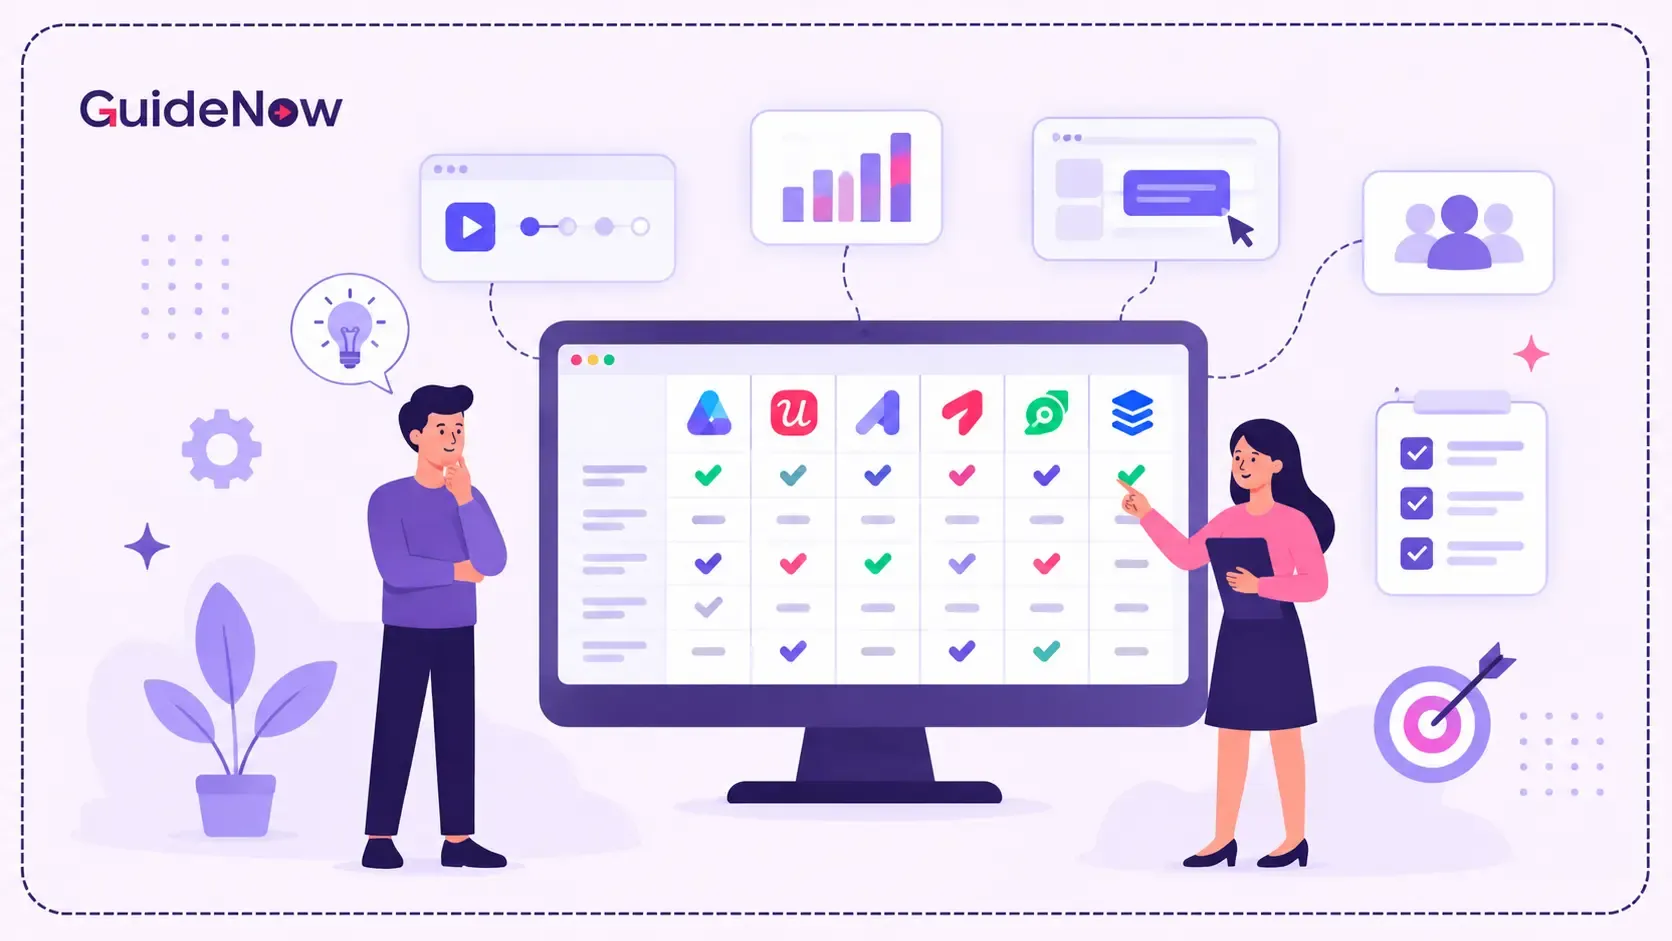
| Platform | User behavior analytics | Guide completion tracking | AI capabilities | Pricing transparency |
| GuideNow | Adoption and behavior insights documented | Confirm exact reports | AI-assisted content creation; analytics AI not confirmed | Contact vendor |
| Whatfix | Product Analytics | Dedicated Guidance Analytics | AI-assisted analysis | Contact vendor |
| WalkMe | Workflow and behavioral analytics | Confirm exact reports | AI-assisted insights | Contact vendor |
| Pendo | Product analytics | Guidance analytics; verify report details | AI capabilities available | Free and quote-based |
| Userpilot | Product analytics | Verify plan-specific reporting | AI Agent Lia | Public plan pricing |
| Mixpanel | Event-based analytics | Via tracked events or integration | Verify current AI features | Free and usage-based |
| Amplitude | Event-based analytics | Via tracked events or integration | AI analytics capabilities | Free and usage-based |
| Heap | Behavioral analytics | Via tracked events or integration | AI assistant on eligible plans | Free and quote/usage-based options |
Important: A platform that can track a completion event does not necessarily provide native guide completion analytics. Verify the precise reporting functionality, integration requirements, and plan limitations before purchasing.
Which Tools Track In-App Guide Completion Rates?
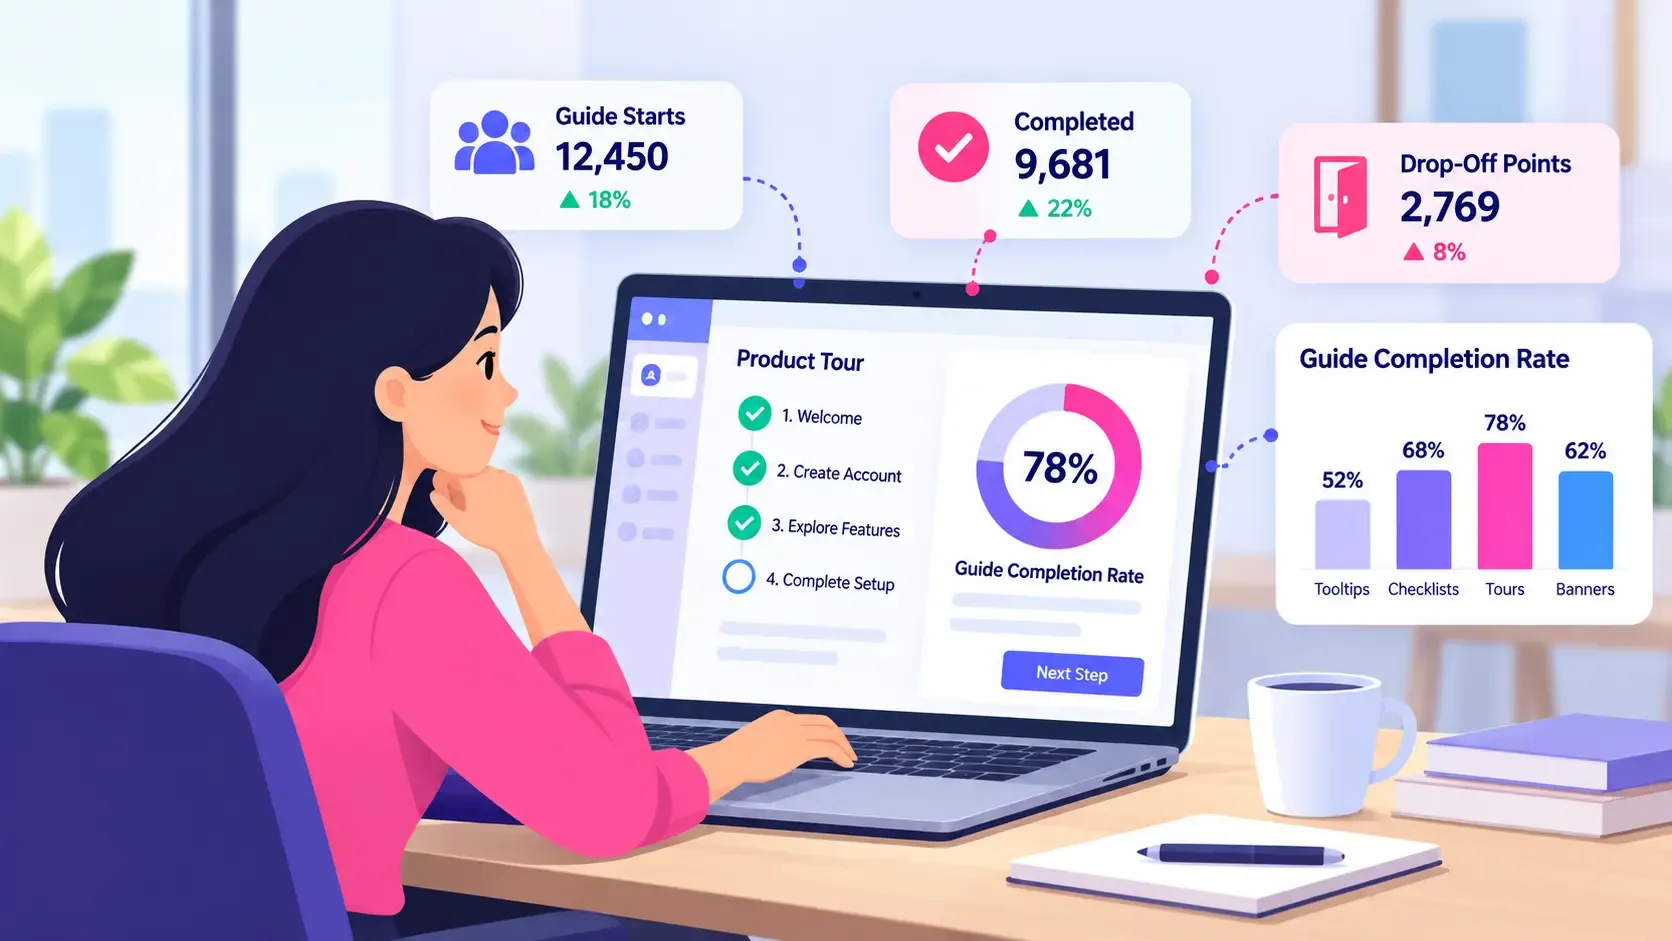
In-app guide completion tracking measures whether users finish a guided experience, such as an interactive walkthrough, checklist, or multi-step onboarding flow.
There are two main approaches.
Dedicated guidance analytics: Platforms such as Whatfix provide analytics designed to report engagement with in-app content, including Flow and Task List completions.
Event-based product analytics: Platforms such as Mixpanel, Amplitude, and Heap can analyze a completion event when it is captured and sent to the analytics system. This approach may require additional instrumentation or integration.
When evaluating tools, ask whether they can report:
- Guide starts and completions.
- Abandonment at individual steps.
- Completion trends by user segment.
- Time spent completing a guided experience.
- Whether users complete the associated task after the guide.
These details help buyers distinguish a basic usage dashboard from a solution designed to evaluate the effectiveness of in-app guidance. If you also need to compare tools for creating interactive walkthroughs and in-app experiences, explore our guide to the best product tour tools in 2026.
What to Check Before Buying Adoption Analytics Software
Before shortlisting a platform, evaluate the following requirements.
1. Reporting depth: Can the tool report individual guide interactions, application events, and workflow completion, or does it provide only high-level engagement data?
2. AI insights: Can AI summarize trends or investigate behavioral patterns? Confirm which AI features are included and which require additional access.
3. Integration requirements: Check compatibility with your enterprise applications, CRM, support tools, and analytics infrastructure.
4. Data accuracy: Ask how user identities, duplicate events, missing events, and reporting delays are handled.
5. Privacy and governance: Review data retention, access controls, consent, sensitive data masking, and applicable compliance requirements.
6. Implementation effort: Understand whether the platform requires code changes, event configuration, browser extensions, or application-specific setup. For a broader implementation strategy, follow an enterprise software rollout plan that connects deployment, user enablement, and adoption measurement.
7. Pricing and scalability: Compare active-user or event limits, analytics access, AI usage, support, and implementation costs.
The best choice is not necessarily the platform with the most charts. It is the one that provides reliable data for the decisions your team needs to make. Once you identify where users struggle, learn how to address common user onboarding friction points with contextual in-app guidance.
Why Consider GuideNow?
GuideNow is worth evaluating if your organization needs contextual in-app guidance alongside adoption-oriented analytics.
Its official product page documents AI-assisted onboarding content creation, interactive guidance, and an analytics dashboard designed to provide real-time insights into user behavior and adoption patterns. The product page also positions the platform around journey optimization and ROI measurement.
These capabilities make GuideNow relevant to teams that want to understand how users interact with enterprise software while helping them navigate complex workflows.
However, the public documentation does not fully specify every analytics report or financial ROI calculation. Buyers should ask for a demonstration of guide completion reports, step-level abandonment, custom event tracking, dashboard exports, and integration options before making a decision.
For teams evaluating GuideNow alongside WalkMe, Whatfix, and Pendo, the key question is whether the available analytics match their required reporting depth and adoption measurement process.
Interested in improving software adoption with in-app guidance?
Explore GuideNow and request a demonstration of its guidance and analytics capabilities.
Conclusion
The best AI dashboards for tracking user behavior and adoption ROI help businesses move beyond basic usage counts to understand how users interact with software and where adoption improvements are needed.
Before making a decision, verify guide completion reporting, AI capabilities, integrations, pricing, and data governance. Choose the platform that provides the right level of visibility into user behavior and supports credible measurement of software adoption outcomes.
Frequently Asked Questions
1. What is an AI analytics dashboard for user adoption?
An AI analytics dashboard for user adoption helps teams analyze software usage, user journeys, feature engagement, and adoption patterns. Depending on the platform, AI can summarize trends, highlight friction, or help teams investigate behavioral data.
2. How can businesses track in-app guide completion rates?
Businesses can use native guidance analytics or capture guide-start and guide-completion events through an analytics platform. More detailed reporting can include step-level abandonment, completion trends, and subsequent task success.
3. Which tools provide user behavior analytics for digital adoption?
Whatfix and WalkMe provide dedicated digital adoption capabilities, while GuideNow documents an adoption analytics dashboard. Pendo and Userpilot combine product analytics with in-app engagement. Mixpanel, Amplitude, and Heap specialize in behavioral and product analytics.
4. How do you measure digital adoption ROI?
Measure changes in relevant outcomes, such as training expenses, support costs, task completion, and productivity. For additional context on workplace efficiency, explore these employee productivity statistics and the challenges they reveal. Compare results against a baseline and account for implementation and ongoing operating costs. Use reliable business data rather than assuming that increased engagement automatically means financial ROI.
5. Can AI dashboards identify user adoption problems?
Yes, when the platform supports the relevant behavioral data and AI analysis capabilities. It may help identify unusual drop-offs, underused features, or friction patterns. Teams should validate these findings before changing onboarding or application workflows.
6. What is the best software for tracking adoption ROI?
WalkMe and Whatfix are worth evaluating for enterprise adoption and guidance analytics. Pendo and Userpilot suit many SaaS product teams, while Mixpanel, Amplitude, and Heap are strong candidates for behavioral analysis. GuideNow is relevant for organizations seeking in-app guidance and adoption-oriented dashboards. The best choice depends on the reporting capabilities, integrations, and business outcomes you need to measure.