Your organization probably has KPIs, but do you actually have KPI analytics?
This distinction matters more than it might appear. Having KPIs (Key Performance Indicators) simply means you have defined a set of metrics you believe to be important and are tracking them somewhere, usually in a spreadsheet, a dashboard, or a slide deck that shows up in your monthly business reviews. On the other hand, having KPI analytics means you have built the infrastructure, processes, and culture to make those metrics genuinely drive your decisions at every level of your business, in real time, without having to wait for a scheduled review.
Most enterprises find themselves much further along the first step than the second. You likely have abundant metrics and dashboards full of numbers. What you might be lacking is the clear connection between those numbers and actual decisions, the discipline to act on what your metrics show, the speed to respond before your window for action closes, and the analytical depth to understand what is driving a metric rather than just seeing what it currently reads.
This blog is all about building that connection. We will show you what a true metrics-driven organization looks like, how your KPI analytics differs from standard KPI reporting, and what the infrastructure and cultural conditions for genuine performance analytics actually require.
What Is KPI Analytics?
KPI analytics is the practice of systematically analyzing your key performance indicators. It is not just about tracking and displaying them; it is about understanding the factors driving them. How they relate to one another, the trends predicting their future direction, and the actions you can take to steer them the right way.
The difference between KPI reporting and KPI analytics is the same as the difference between just seeing a number and actually understanding it. While KPI reporting simply tells you that your customer churn increased from 4.2% to 5.1% last month, KPI analytics digs deeper. It tells you exactly which customer segments are churning the most, which product usage patterns relate to your churn risk, what the leading indicators were in the weeks before those accounts left, and which actions have historically worked best to reverse that trend.
To do business intelligence and KPI reporting, you just need a dashboard. But for KPI analytics, you need a real-time analytics platform. This platform must be capable of drilling past surface-level metrics, connecting your KPIs to their root drivers, and surfacing the contextual intelligence needed to turn a simple number into direct action.
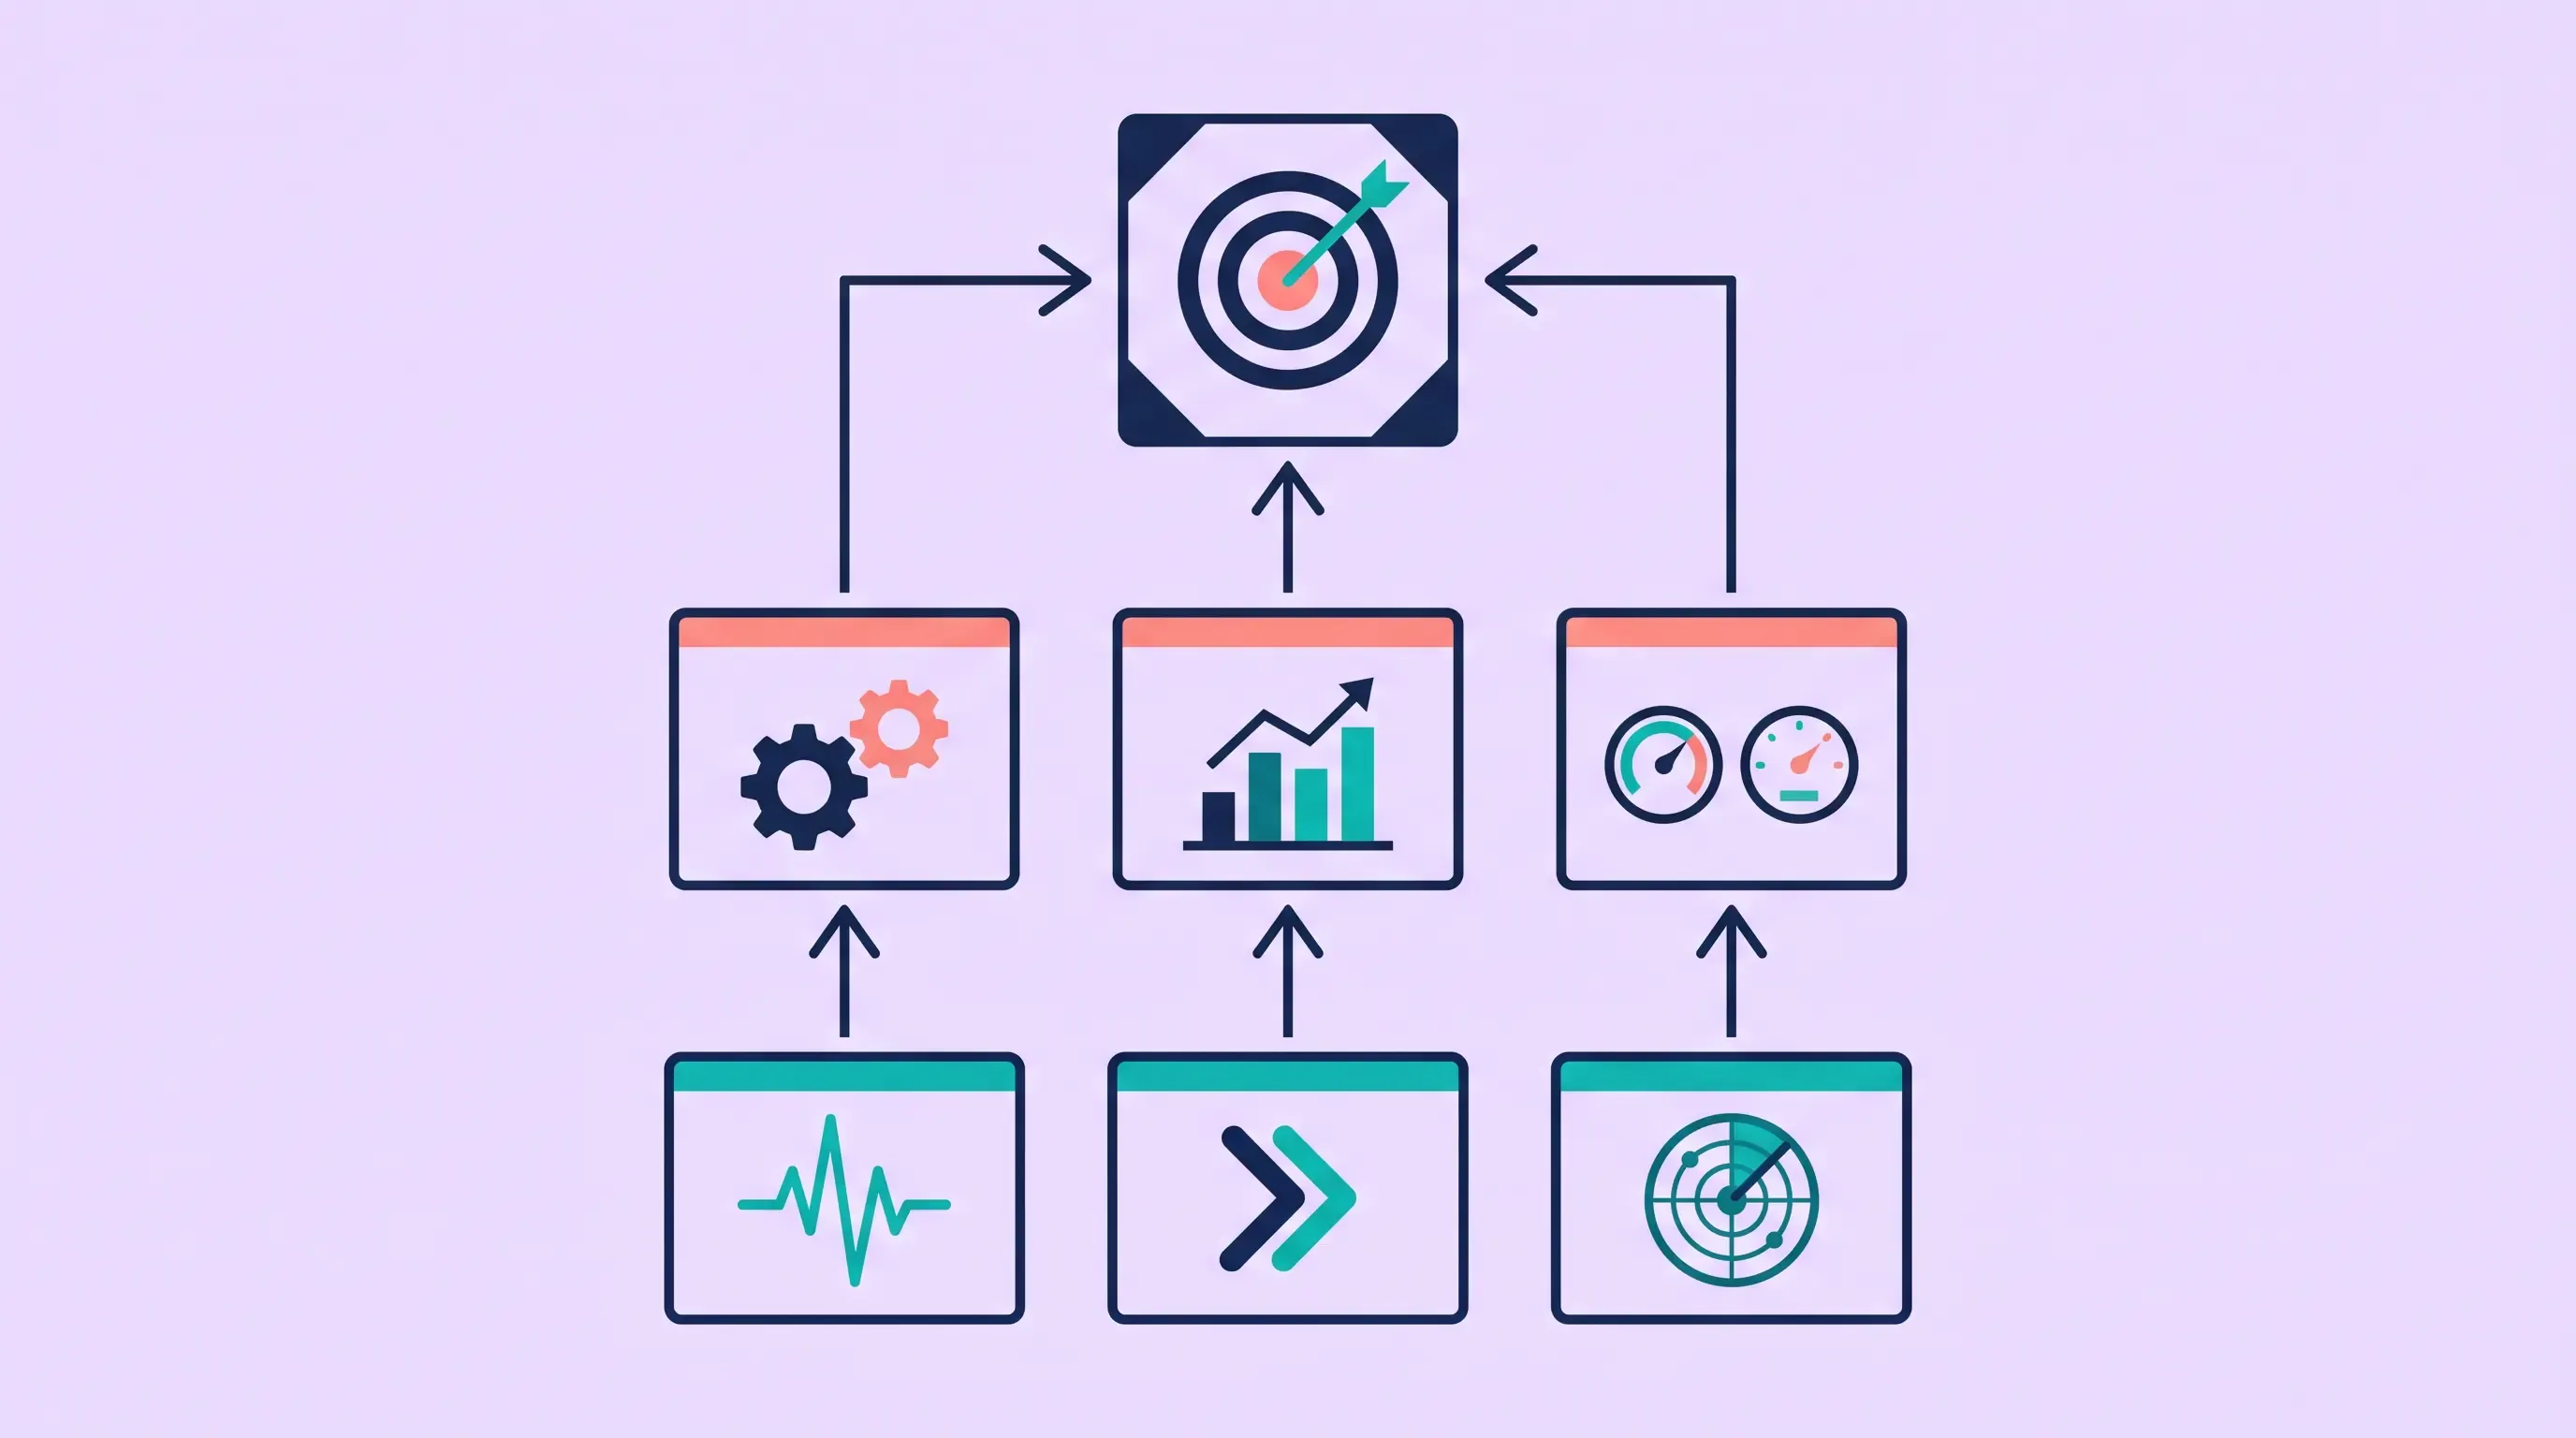
The Architecture of a KPI Framework That Actually Works
Tier 1: Strategic KPIs
Strategic KPIs are the handful of metrics directly reflecting whether your organization is achieving its highest-level goals. If you run a SaaS business, these might include your annual recurring revenue, net revenue retention, and customer acquisition cost payback period. If you are in manufacturing, they might be capacity utilization, on-time delivery rate, and cost per unit.
At your company, executives should own these strategic KPIs. You will typically review them in board and leadership meetings, and they should rarely change. They represent your organization's core idea of what success looks like. This idea should remain stable so you aren't shifting metrics every quarter just to highlight what looks best on a report.
Tier 2: Operational KPIs
Operational KPIs are the specific metrics your functional leaders use to manage their departments. These might include revenue by product line and territory for your sales team, campaign conversion rates for marketing, fill rate and days-on-hand for the supply chain, or utilization and ticket resolution times for service teams. These operational metrics drive your strategic KPIs, and you should review them weekly or even daily instead of monthly.
You must ensure the link between your operational KPIs and strategic KPIs is explicit and clearly understood. For example, if your sales leader knows their territory's ARR is falling behind, they will be much more effective if they also know exactly which operational metric, such as pipeline coverage, average deal size, conversion rate, or sales cycle length, is causing that gap. Without this connection, your operational metrics turn into a simple reporting exercise completely detached from the strategic outcomes they are meant to influence.
Tier 3: Leading Indicators
The most analytically advanced part of your KPI framework is the leading indicator layer. These are the metrics that predict the future performance of your strategic and operational KPIs before your lagging metrics even budge.
For example, your product usage frequency can predict renewal rates weeks before a contract expires. Your sales activity metrics can warn you about pipeline coverage gaps before the quarter officially closes. Likewise, tracking supplier lead time variability helps you predict inventory risk before you run out of stock. When you build leading indicator tracking into your KPI framework, you start managing your future performance instead of just documenting the past. This is the ultimate defining trait of a genuinely metrics-driven organization.
Common KPI Framework Failures
Too Many Metrics
The most frequent mistake you might make in KPI design is having too many metrics. It is easy for your organization to add metrics one by one. Every new initiative brings new tracking requirements, and every new leader brings their favorite indicators. Before you know it, your dashboard is cluttered with dozens of numbers that no one actually has the bandwidth to monitor in a meaningful way.
Remember: when everything is a KPI, nothing is a KPI. The true discipline of a metrics-driven organization lies not in tracking everything, but in tracking the right things and acting on them consistently. To build a well-designed framework, you should typically limit yourself to no more than five to eight KPIs at each tier, ensuring clear ownership and defined accountability at every level.
Vanity Metrics That Do Not Connect to Outcomes
Vanity metrics are those numbers that easily go up and make you feel good in review meetings, but they do not directly connect to your actual business outcomes. Think of page views that never convert to sales, app downloads from users who never even activate the app, or sales activities that fail to generate a real pipeline. While these metrics aren't necessarily harmful on their own, giving them a top spot in your KPI framework will crowd out the metrics that actually matter. In the end, they just give you a misleading picture of your organization's true health.
Metrics Without Owners
A KPI without a specific owner is basically just a decoration. If you want a metric to truly drive behavior, you must hold someone accountable for its trajectory. This person needs the authority to step in and take action when the numbers go in the wrong direction, and your organization must fully expect them to do exactly that. If you try to run KPI analytics without clear ownership, you will only gain insights without any real-world consequences.
Reporting Cadence Misaligned with Decision Windows
If one of your metrics is crucial for daily operational choices but you only review it once a week, your reporting schedule is destroying that metric's value. Your decision window (the timeframe when your actions can actually change the outcome) must dictate how often you look at a KPI and who sees it. This is a major reason why you need real-time business insights infrastructure. When a metric shifts and demands a response, your team members who have the authority to fix it need to know immediately, not at your next scheduled meeting.
Building the Analytical Infrastructure for KPI Analytics
A Single Source of Truth for Metric Definitions
For KPI analytics to work, you have to make sure every metric means the exact same thing to everyone using it. In most companies, terms like revenue, churn, conversion rate, and utilization have different definitions across different departments. When this happens, the same underlying metric yields different numbers across your reports, and you end up wasting your meetings arguing over definitions rather than discussing what the data actually means.
To fix this, you need a metrics catalog. This is a secure, centralized hub that clearly defines each KPI, its calculation methodology, its data sources, and its owners. Think of it as the foundational infrastructure for your metrics-driven organization. Without it, your KPI analytics will just spit out numbers that no one on your team trusts.
Ultimately, this is a basic data governance requirement: you must have consistent metric definitions that are strictly enforced at the data layer and easily visible to all your users through one shared interface.
Real-Time Data Pipelines to Live Sources
If your KPI analytics relies on batch-refreshed data, it simply cannot support your real-time decision-making. You must connect your KPI tracking directly to live operational data sources, such as your CRM, ERP, operational databases, or external feeds. This ensures that the numbers your decision-makers see reflect the actual, current state of your business rather than how things looked during the last batch run.
AI-Powered Drill-Down and Driver Analysis
The analytical depth separating true KPI analytics from basic reporting requires AI-powered tools that can automatically drill down from a metric to its root drivers. For example, if your churn rate spikes, your system should instantly pinpoint which segments, products, geographies, or usage patterns are responsible. You shouldn't have to wait a whole day for an analyst to investigate; you need answers the exact moment the metric moves.
This is exactly where augmented analytics capabilities (like automated pattern detection, anomaly identification, and driver analysis) become essential infrastructure for a mature KPI analytics setup.
Self-Service Access for All Metric Owners
To run a truly metrics-driven organization, you must ensure that every person accountable for a KPI can independently access and explore their data without routing requests through a central analytics team. When one of your operational KPI owners needs to know why their numbers shifted, they cannot afford to wait 48 hours for an analyst to produce a breakdown. By providing self-service analytics infrastructure (including natural language querying, governed data access, and instant visualization) you empower your team to get answers immediately, driving true data democratization and scale your data efforts seamlessly.
The Cultural Conditions for a Metrics-Driven Organization
Technology is necessary, but it is not sufficient on its own. To foster a metrics-driven culture, you have to ensure that your metrics genuinely drive your decisions. You cannot just review them and then push them aside the second they conflict with your company’s traditional preferences or political dynamics.
Leadership That Acts on What the Data Shows
Your metrics-driven culture is set at the top. If your senior leaders make decisions that contradict what the data shows without clearly explaining why the metrics might be flawed or incomplete, they are telling your entire company that data is optional. Conversely, when you and your leadership team consistently rely on metrics, even when the results are uncomfortable, you establish a powerful standard that the rest of your organization will follow.
Psychological Safety Around Bad Numbers
One of the most frequent ways a metrics-driven culture fails in practice is when bad numbers become politically dangerous to share. If your team feels that reporting a dropping KPI will be viewed as a personal failure rather than simply useful information, they will find ways to smooth out the numbers, delay their reports, or spin the results so the drop looks less severe than it really is. To build a genuine metrics culture, you must ensure that bringing up a problem early is rewarded, not penalized.
Metric Reviews Focused on Action, Not Explanation
In most organizations, business review meetings are mostly retrospective. Leaders present last month's numbers, explain what caused them, and move on. However, in your metrics-driven organization, you should spend the majority of your review time focusing on a forward-looking question: based on what our metrics show, what are we going to do differently? Your analytical platform must support this approach by surfacing not only what happened in the past but also what the data suggests you should do next.
How Caddie Powers KPI Analytics
Caddie is designed to help you close the gap between simply seeing a metric and truly understanding it. The platform connects directly to your live enterprise data sources, using conversational analytics to allow your metric owners in every department to query their KPIs using natural language. Instead of just asking, "What is my churn rate?" you can ask, "Why did it change last week?" or "Which customer segments are driving this movement?" You will instantly receive accurate, governed, and fully contextualized answers.
Because of this natural language interface, your KPI analytics become accessible to everyone accountable for a metric, rather than just the analysts who have BI tool access. Caddie's AI interpretation layer ensures that whenever one of your KPIs moves, the system automatically surfaces the underlying driver analysis. This slashes your timeline from getting a metric alert to achieving actionable understanding from days down to mere seconds.
If you are an enterprise leader aiming to build a genuinely metrics-driven organization, Caddie gives you the analytical infrastructure needed to make true KPI ownership a reality. You get the power to understand your numbers independently, at the exact speed your business demands, all without needing a specialist intermediary at every step.
Frequently Asked Questions
What is KPI analytics?
KPI analytics is the practice of systematically analyzing your key performance indicators far beyond surface-level tracking. It involves understanding exactly what drives your numbers, how they relate to one another, what signals predict their future direction, and what actions you can take to steer them toward your desired outcomes. It stands apart from standard KPI reporting because it delivers deep understanding and actionable steps, not just basic visibility.
What is a metrics-driven organization?
A metrics-driven organization is a company where key performance indicators genuinely inform and drive your decisions at every single level of the business. In this environment, you connect every metric to clear ownership and accountability. Your analytical infrastructure gives you a real-time understanding of what drives each number, and your culture actively rewards your team for acting on the data rather than making excuses to ignore it.
What are the best KPI reporting tools for enterprises?
The strongest enterprise KPI reporting tools provide you with a blend of real-time data connectivity, AI-powered driver analysis, and natural language querying for easy self-service exploration. They also offer strictly governed metric definitions that remain consistent for all your users, alongside proactive alerts whenever your KPIs breach specific thresholds. Ultimately, the perfect tool for you will depend entirely on your current data infrastructure and how analytically advanced your KPI owners need to be.
What is an enterprise KPI dashboard?
An enterprise KPI dashboard is a visual interface that displays key performance indicators across all your organization's departments and levels. It covers everything from strategic metrics for your executives down to operational metrics for your daily teams. If you use a modern enterprise KPI dashboard, you will get much more than static charts; you gain drill-down capabilities, root driver analysis, and AI-generated interpretations of exactly what your metrics mean within your specific business context.
How do you build a metrics-driven organization?
To build a metrics-driven organization, you need to make four parallel investments. First, create a well-designed KPI framework linking your leading indicators and operational metrics directly to strategic outcomes. Second, establish an analytical infrastructure that provides real-time, accurate, and consistent data to every metric owner. Third, offer self-service access so your team's accountability never relies on an analyst's availability. Finally, foster cultural leadership that consistently makes decisions grounded in exactly what the data shows.
What is performance analytics?
Performance analytics is the systematic analysis of metrics designed to measure how effectively your organization, function, team, or process is achieving its objectives. It covers everything from tracking your operational KPIs to measuring your high-level strategic outcomes. In its most mature form, it uses predictive and prescriptive AI to help you move beyond merely understanding your past performance so you can actively shape your future results.