Charts have quietly become the interface between your data and your decisions. Most of what gets published about data visualization, though, is opinion dressed up as insight. So here are the numbers instead.
Below you will find 50 verified data visualization statistics covering market growth, enterprise adoption, analyst workload, visual literacy, and where the category is heading. Every figure links to its source so you can check it yourself. Use them to build a business case, sharpen a board deck, or work out why your dashboards are not landing the way you hoped.
Data Visualization Market Size and Growth Statistics
Start with the money. Analyst houses disagree on the exact number, but they agree on the direction and the pace.
1. The global data visualization market was valued at $10.92 billion in 2025 and is forecast to reach $18.36 billion by 2030, a compound annual growth rate of 10.95%.
2. Cloud deployment already captured 63.45% of data visualization market share in 2024, and the cloud segment is expanding at a 12.65% CAGR through 2030, outpacing the market overall.
3. A second independent model sizes the market at $12.702 billion in 2025 rising to $21.423 billion by 2030, an 11.02% CAGR that lands strikingly close to the first forecast.
4. The data visualization tools market specifically is expected to add $7.95 billion between 2024 and 2029, growing at an 11.2% CAGR.
5. The broader data and analytics software market reached $175 billion in 2025 and is forecast to hit $358 billion by 2029, a 15.4% CAGR at constant currency.
6. Global data volume was forecast to reach 182 zettabytes in 2025 and more than double to 394 zettabytes by 2028.
7. Inside the average enterprise, data and analytics leaders estimate overall data volumes grow 25% every year.
Why Data Visualization Matters for Business Decisions
Leaders say they are data-driven. The evidence suggests the ambition is running ahead of the reality, which is exactly the gap good visualization and modern business intelligence are meant to close.
8. 63% of business leaders now describe their organizations as very data-driven, up from 53% in 2023, yet 63% of technical leaders admit their companies still struggle to turn that data into business priorities.
9. 76% of business leaders report growing pressure to demonstrate business value from data.
10. 84% of data and analytics leaders say their data strategy needs a complete overhaul before AI ambitions can succeed, and 88% agree AI demands entirely new approaches to governance and security.
11. 54% of business leaders are not fully confident the data they need is even accessible to them.
12. Data and analytics leaders classify 26% of their organization's data as outright untrustworthy.
13. 56% of organizations name improved decision-making their single top goal for AI-powered analytics, ahead of cost savings and efficiency.
14. Faster decision-making is the leading analytics outcome for 69% of UK organizations, while 62% of software and technology firms point instead to competitive advantage.
15. 90% of business leaders say direct data access inside the apps they already work in would improve their performance, and 86% say they would use data more often if it appeared in their workflow.
Data Visualization Adoption and Self-Service Analytics Statistics
Access is the real bottleneck. The shift toward self-service analytics is well underway on paper, but the usage numbers tell a more sobering story.
16. Only 8% of employees at most firms currently use advanced analytics tools, though 24% of organizations plan to triple that number within twelve months.
17. 58.7% of organizations already run advanced business intelligence and analytics platforms, and 52.3% are standardizing and integrating data across departments for consistency.
18. 45.5% now operate a corporate data strategy with enterprise-wide governance in place.
19. Only 20% let employees query data in natural language through AI-powered interfaces, and just 16.2% are piloting responsible AI to shape enterprise decisions proactively.
20. In financial services, only 3% of firms give at least one in five employees access to AI-powered analytics today, a figure expected to jump to 31% within twelve months.
21. 51% of financial services firms have already deployed self-service analytics for their business teams.
22. 68% of industrial organizations report positive business impact from AI-powered analytics, and 40% of manufacturing and construction firms have deployed semantic governance organization-wide.
23. 75% of Asia-Pacific organizations cite operational efficiency as their top analytics benefit.
24. Despite all of it, average active employee usage of BI and analytics tools sits at just 25%, a number that has barely moved across seven years of tracking.
What Poor Visualization and Reporting Backlogs Actually Cost
Every hour an analyst spends rebuilding the same chart is an hour a decision waits. This is the clearest argument for moving beyond static dashboards and manual report cycles.
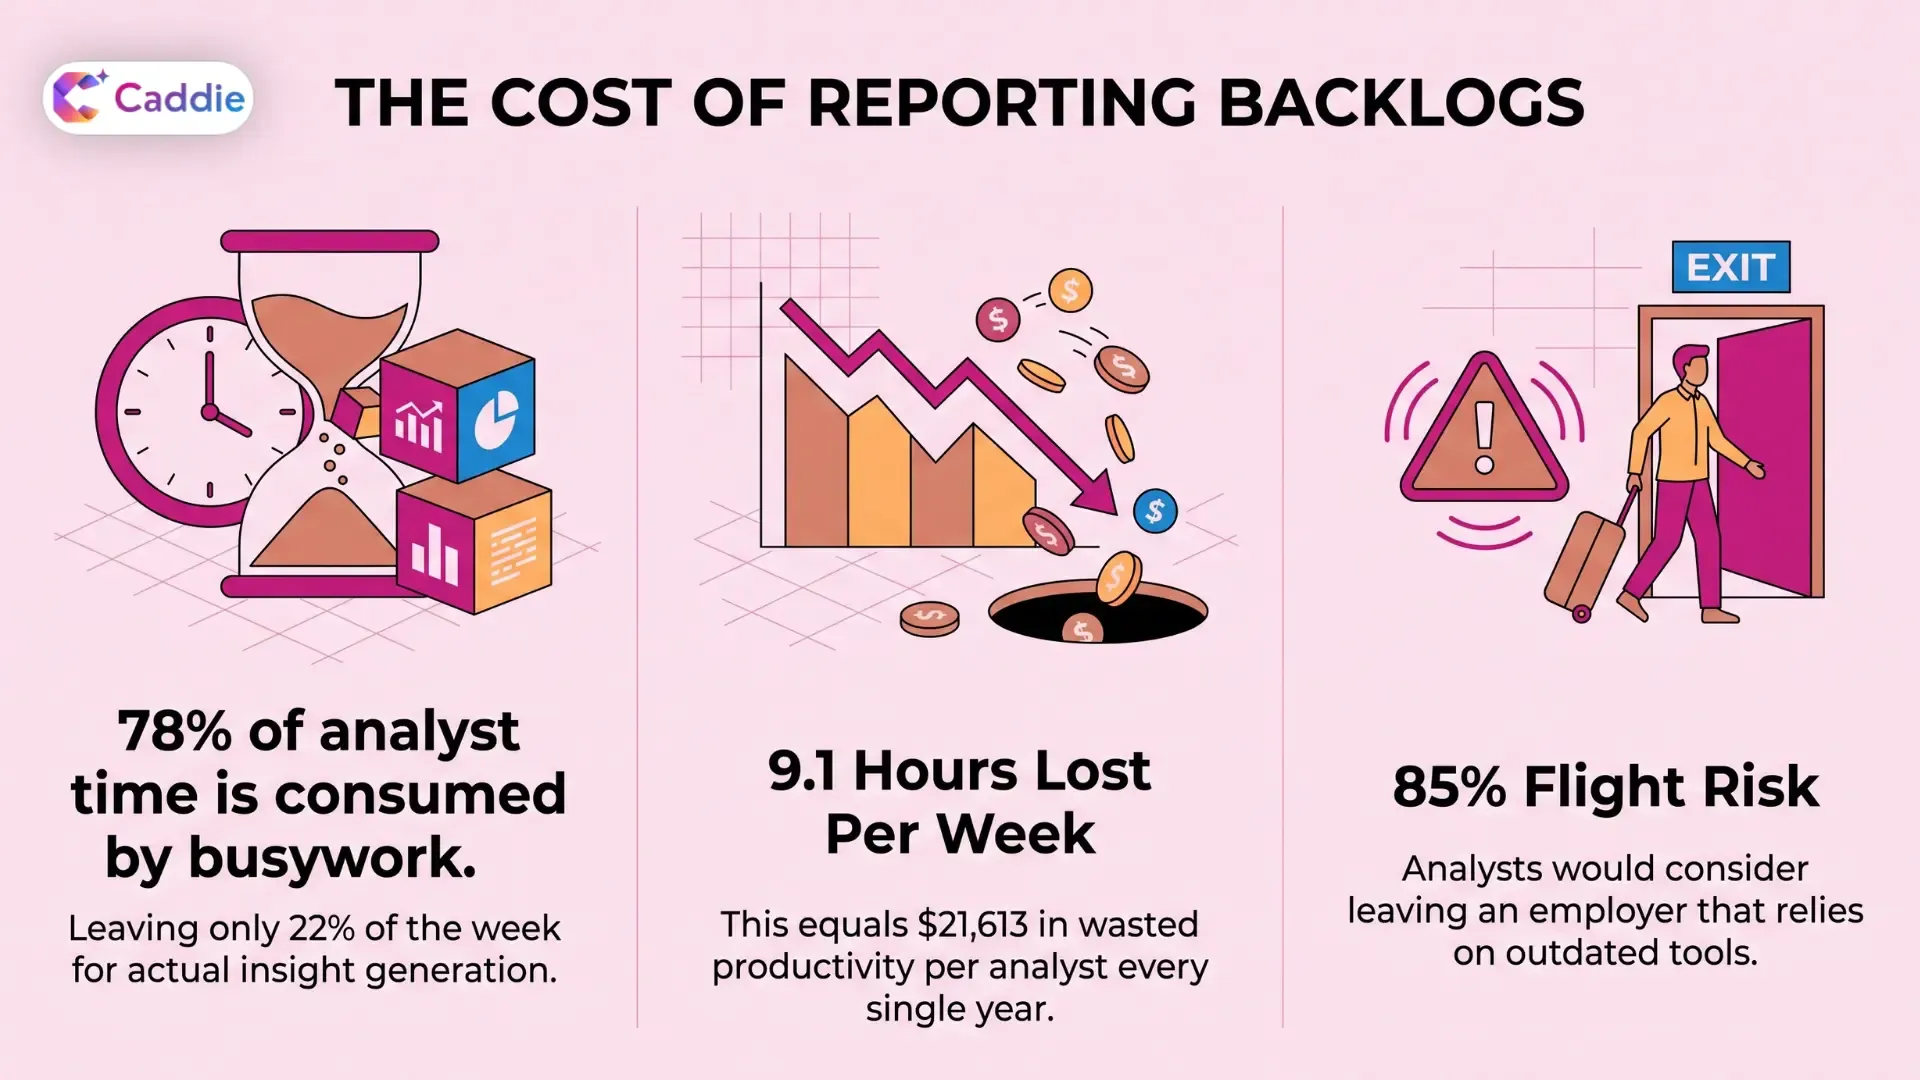
25. Organizations lose 9.1 hours per analyst every single week to inefficient workflows, which works out to $21,613 in wasted productivity per analyst per year.
26. 78% of analyst time is consumed by busywork such as data prep, validation, and tool navigation, leaving only 22% of the week for actual insight generation.
27. The retention stakes are real: 96% of analysts are more likely to stay with employers who invest in workflow optimization, and 85% would consider leaving one that relies on outdated tools.
28. Given better self-service platforms, 47% of analysts expect to produce more impactful insights and 43% expect significant gains in data quality and consistency. (dbt Labs and The Harris Poll)
29. Those findings draw on 510 analysts working at companies with 500 or more employees, so they reflect enterprise conditions rather than small-team constraints. (dbt Labs and The Harris Poll)
30. 57% of organizations report rising warehouse and compute spend while only 36% report matching growth in team budgets, widening the gap between infrastructure and the people who use it.
31. Fewer than half of technical leaders have a data governance framework in place at all.
Data Visualization Best Practices, Literacy, and Trust Statistics
A chart that misleads is worse than no chart. These numbers explain why visual design choices and genuine data democratization have to travel together.
32. Trust in data climbed from 66% to 83% as a stated organizational priority between 2025 and 2026, while shipping data products faster rose from 50% to 71% over the same twelve months.
33. A 2025 study tested 14 distinct types of misleading data visualization and found axis distortions the worst offenders, with inverted y-axes, irregular intervals, and dual axes all significantly reducing interpretation accuracy.
34. Higher data literacy improved reader performance in that study, but several misleading design features continued to impair comprehension even among visually literate readers.
35. A taxonomy built from more than 1,000 real-world charts identified 74 distinct types of visualization issues, spanning both structural problems and context-related ones.
36. Eye-tracking research shows readers with low graph literacy over-rely on the shape of a line and skip the axis labels and scale numbers that give it meaning.
37. 86% of business leaders say their careers depend on how data literate they are, and 72% say their trajectory depends on how data-driven they are.
38. Drive for data literacy peaks in sales at 90% and marketing at 89%.
39. Confidence is moving the wrong way: belief in data's relevance to business objectives fell 18% against the 2023 benchmark, and confidence in data accuracy fell 27%.
40. Self-described right-brained leaders, who make up 47% of respondents, are 54% more likely to say they do not know what questions to ask their data.
Data Visualization Trends and the Future of Visual Analytics
The next phase is less about prettier charts and more about machines participating in the analysis. Expect augmented analytics and agent-driven workflows to reshape what a dashboard even is.
41. By 2027, 75% of hiring processes will include certifications and testing for workplace AI proficiency during recruiting.
42. Through 2027, GenAI and AI agent use will create the first serious challenge to mainstream productivity tools in thirty years, prompting a $58 billion market shakeup.
43. By 2029, AI agents are projected to generate ten times more data from physical environments than from all digital AI applications combined.
44. By 2030, 50% of organizations will use autonomous agents to translate governance policies into machine-verifiable data contracts, and half of all AI agent deployment failures will trace back to insufficient governance runtime enforcement.
45. By 2030, universal semantic layers will be treated as critical infrastructure alongside data platforms and cybersecurity, because they are the only reliable way to keep AI answers consistent.
46. Some organizations are already there: 46% of UK firms have implemented a corporate-wide semantic data layer.
47. By 2030, 60% of organizations that successfully differentiate with AI will be led by executives who prioritize mastery of human relational skills.
48. By 2028, 50% of content risk roles will migrate out of legal and cybersecurity and into AI engineering.
49. The speed-versus-quality gap is visible right now: 72% of data teams prioritize AI-assisted coding, but only 24% prioritize AI-assisted pipeline management such as testing and observability.
50. Those 2026 analytics engineering findings draw on 363 practitioners and leaders surveyed between December 2025 and February 2026.
What These Data Visualization Statistics Mean for You
Read the numbers together and one pattern emerges. Spending on visualization is climbing steadily. Data volumes are climbing faster. But the share of employees who can look at a chart and act on it has barely moved in seven years.
That gap is not a tooling problem in the way most teams assume. Organizations already own capable platforms. What they lack is a path from a business question to a trustworthy visual answer that does not route through an analyst queue. When 78% of analyst time goes to busywork and only 8% of your workforce touches advanced analytics, the constraint is access, not software.
The teams pulling ahead treat visualization as part of a wider decision intelligence practice: governed data, semantic consistency, and natural language interfaces that let people ask follow-up questions instead of filing a ticket.
Turn These Numbers Into Answers With Caddie
Most of the gaps above trace back to one thing: business users cannot get an answer without going through someone else. Caddie, the enterprise AI assistant from VividMinds, closes that loop. Ask a question in plain language across your databases, documents, and spreadsheets, and get back charts, tables, and clear answers in seconds. No dashboard build, no report queue, no SQL required. Role-based access, SSO, and MFA keep the right data with the right people, so self-service does not mean ungoverned. Caddie helps your team reach better decisions faster, without waiting on specialists.
See how fast your team can go from question to answer. Book a Caddie demo today.
Frequently Asked Questions
How big is the data visualization market?
Forecasts range from roughly $11 billion to $12.7 billion for 2025, growing near 11% annually toward $18 billion to $21 billion by 2030.
Why is data visualization important for business decisions?
It shortens the distance between a question and an answer. Leaders act faster when patterns are visible, and 56% name better decision-making their top analytics goal.
What are the most important data visualization best practices?
Avoid axis distortion, label clearly, match the chart type to the question, and design for readers with low graph literacy rather than for analysts.
What are the main data visualization trends for 2026?
Natural language querying, semantic layers as shared infrastructure, agentic analytics, and AI-generated visuals governed by stronger trust and validation controls.
How many employees actually use analytics tools?
Only about 8% of employees use advanced analytics tools, and average active BI usage sits near 25%, a figure flat for years.